- Search Crypto Craft
- 28 Results (1 Thread , 27 Replies )
- jhonayahya replied Nov 21, 2019
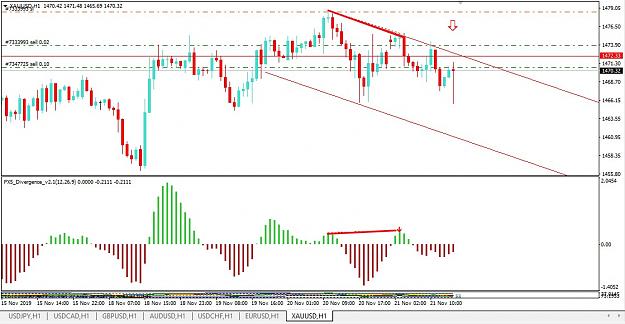
Hidden divergence on GOLD. Short @ 1470.73. SL arround 1480. image
Hidden divergence
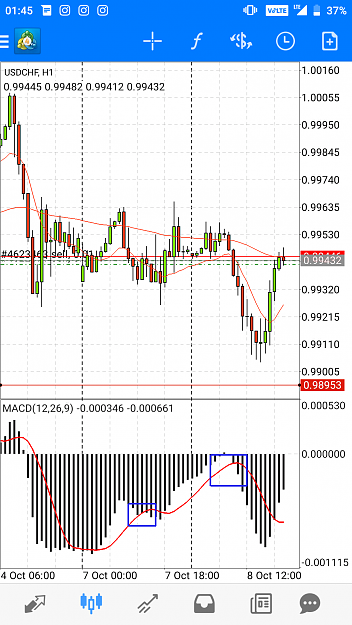
- jhonayahya replied Oct 11, 2019
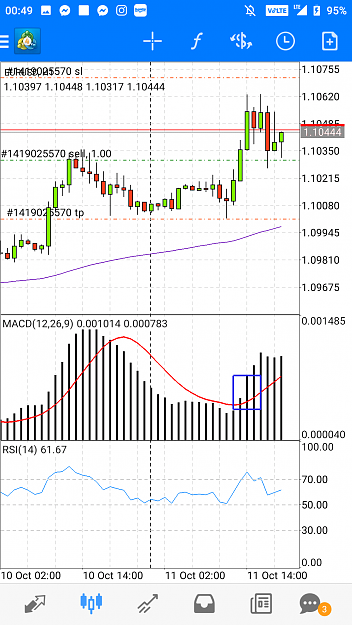
image I think just one is enough. To make profitable, use risk reward.
MACD and RSI opposite crosses
- jhonayahya replied Oct 8, 2019
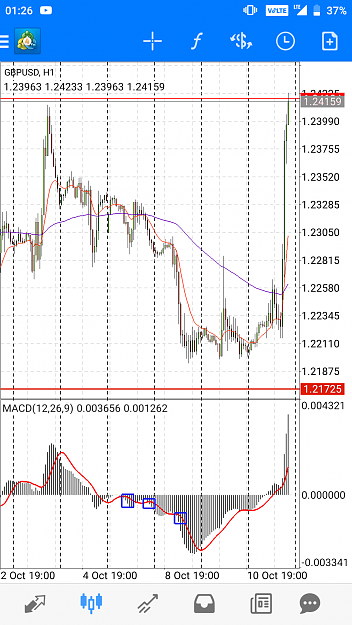
image Is that opposite cross? Am I doing correctly?
MACD and RSI opposite crosses
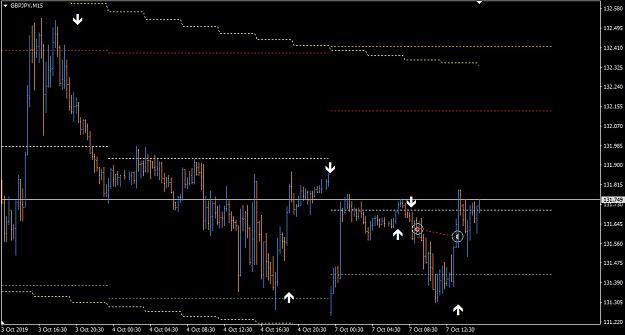
- jhonayahya replied Oct 7, 2019
First trade today on GBPJPY is not very good trade, price got hit breakeven. I'm usually start trail my stoploss when price hit TP1. Still winning trade. image
(binned per thread starter's request) Beat The Market strategy
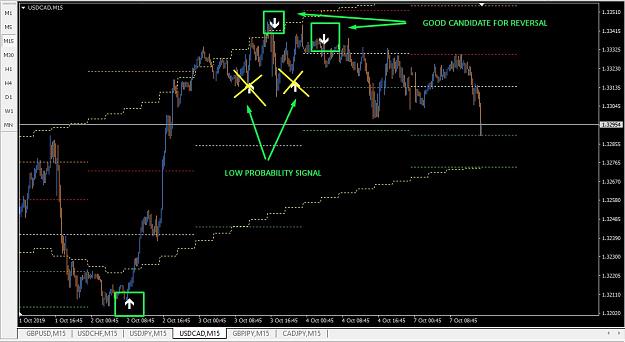
- jhonayahya replied Oct 7, 2019
Hello BTM, I give my contribution to the thread. I think when arrow is appear on upper side when trend is UP this signal is weak and has low probability. When down arrow is appear, and price is outside the bands it was good signal for reversal ...
(binned per thread starter's request) Beat The Market strategy
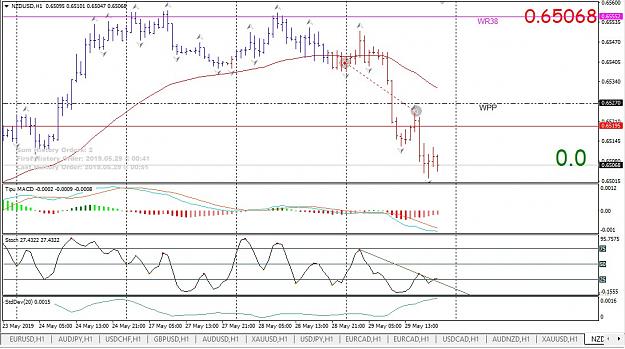
- jhonayahya replied May 29, 2019
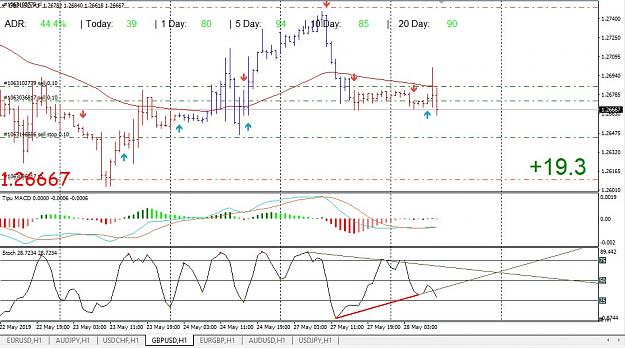
NZDUSD early exit on pullback, didn't expect trend still continue. Lesson today is don't exit the market too early. image
Stress Free Trading Strategy, Simple as 1-2-3
- jhonayahya replied May 29, 2019
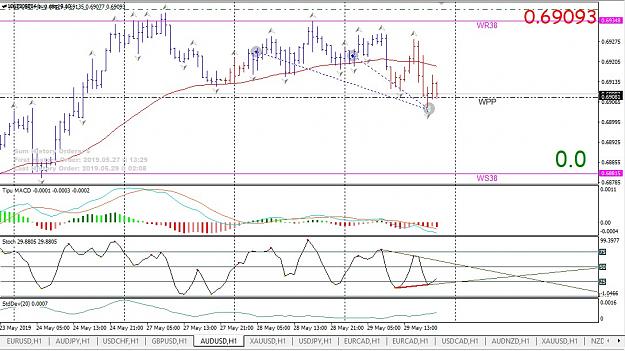
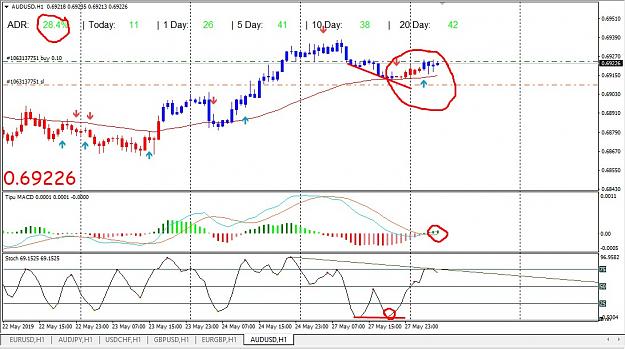
Result from AUDUSD. This is losing trade, got hit SL. image
Stress Free Trading Strategy, Simple as 1-2-3
- jhonayahya replied May 29, 2019
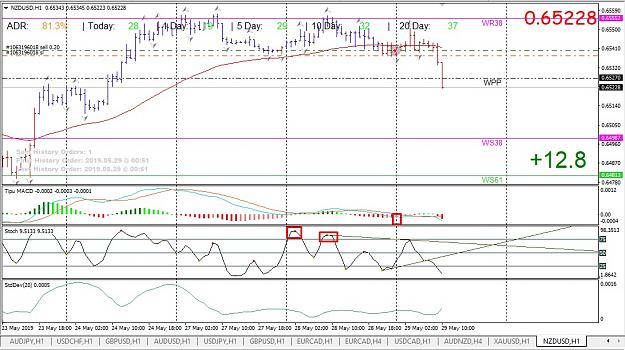
NZDUSD now 12 pips in profit. image
Stress Free Trading Strategy, Simple as 1-2-3
- jhonayahya replied May 29, 2019
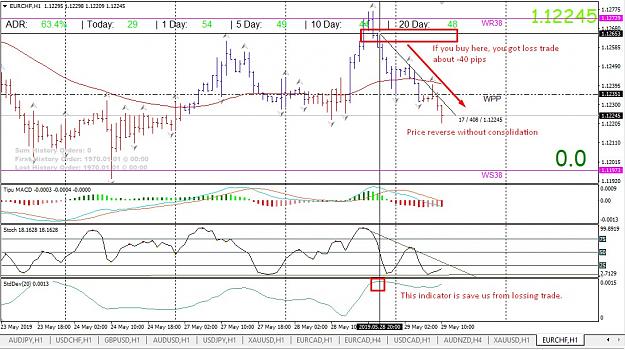
This is how StdDev indicator is saving us from losing trade. image image
Stress Free Trading Strategy, Simple as 1-2-3
- jhonayahya replied May 29, 2019
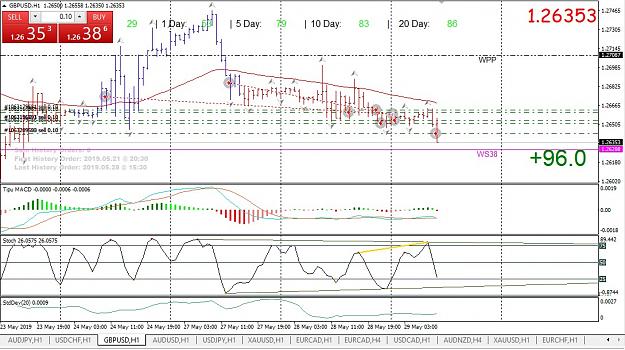
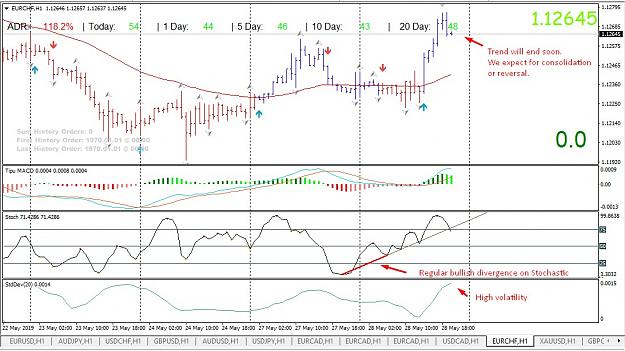
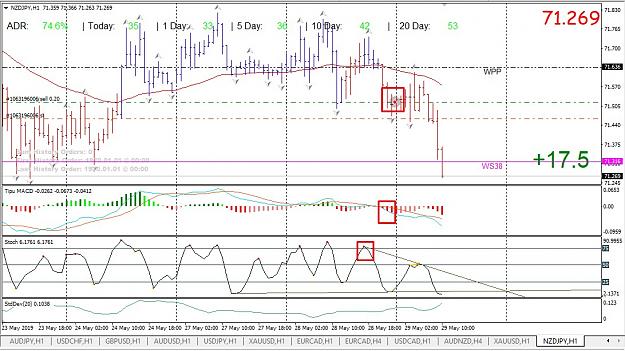
Strong Yen today on Asia session, notice Standard Deviation is increasing means high volatility during this session. Price is also currently below weekly pivot indicate bearish bias. image
Stress Free Trading Strategy, Simple as 1-2-3
- jhonayahya replied May 28, 2019
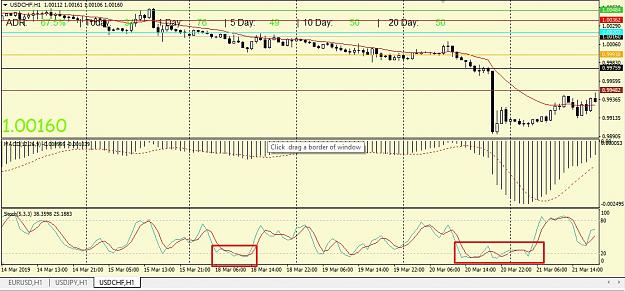
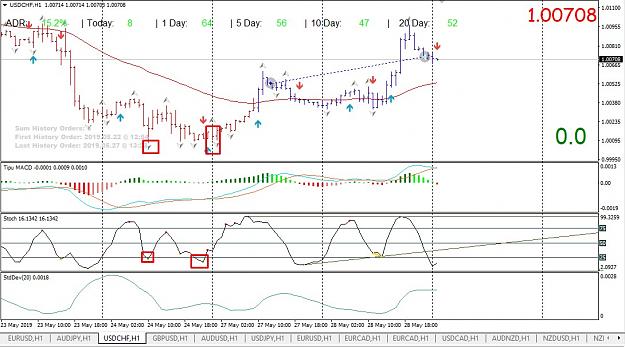
Successful trade on USDCHF. Notice because I have to wait confirmation from lagging indicator, a little bit late to catch the trend, but I still be able to made profit about 20 pips. In the red box shows 2 reversal signal from stochastic, but I ...
Stress Free Trading Strategy, Simple as 1-2-3
- jhonayahya replied May 28, 2019
This is example how to measure volatility. Also at this time is not good to place any trade because price is too far from the baseline (EMA 50). image
Stress Free Trading Strategy, Simple as 1-2-3

- jhonayahya replied May 28, 2019
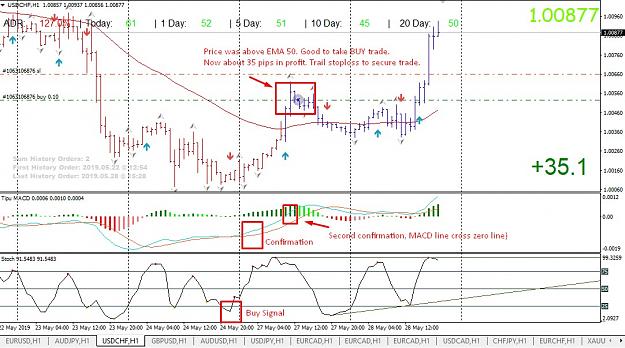
USDCHF. A buy trade was made yesterday. A little drawdown occur. But now already in profit. This is the correct way using stochastic, not take all signal blindly without confirmation image
Stress Free Trading Strategy, Simple as 1-2-3
- jhonayahya replied May 27, 2019
Good morning everyone, today was 11.11 AM at GMT+8. Today a trade was made on Aussie Dollar. Stochastic %K line has been enter the oversold zone. Trend is up, price is above EMA 50. MACD line is above zero line. This is aggressive entry since small ...
Stress Free Trading Strategy, Simple as 1-2-3
- jhonayahya replied May 26, 2019
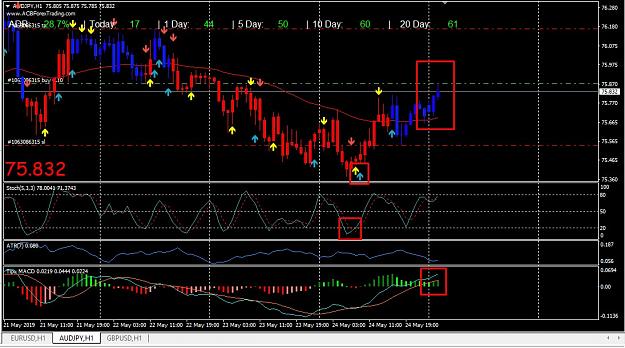
Today, a trade was made on Aussie Yen. Stochastic has give buy signal, MACD line (or histogram bars) is above signal line, and there is angle between them. MACD is above zero and price currently is above EMA 50. Later I will upload this new ...
Stress Free Trading Strategy, Simple as 1-2-3
- jhonayahya replied May 25, 2019
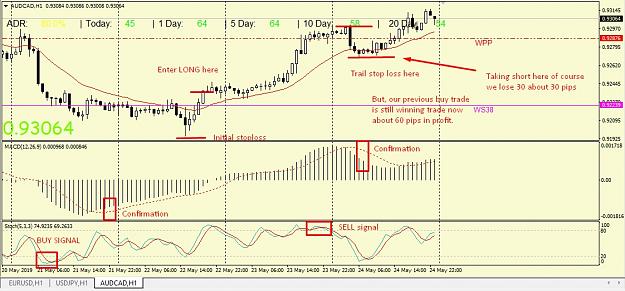
Trade example on Aussie Loonie image
Stress Free Trading Strategy, Simple as 1-2-3
- jhonayahya replied May 25, 2019
Here is an example when market is trending down, and stochastic stays in 0-20 zone for several hours. Again here, no confirmation for taking long trade since price is below EMA 20. In the case of trending market stochastic can stays in zone 0-20 and ...
Stress Free Trading Strategy, Simple as 1-2-3