- Search Crypto Craft
- 41 Results
-
 cougar73 replied May 18, 2014
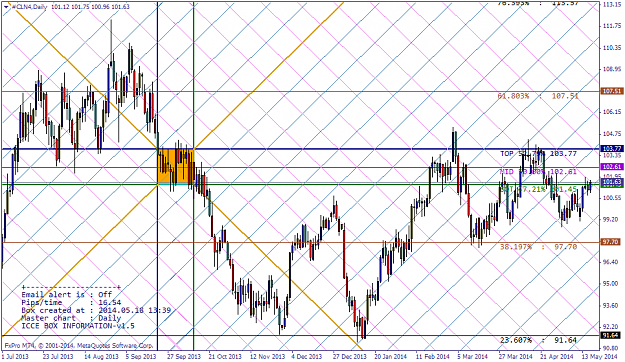
One of my friends asked me if I would please turn my attentions to the recent activities in the Oil Futures market (CL). The Oil companies like it when oil stays above $90 a barrel and OPEC prefers $100 a barrel for both Brent and WTI crudes. With ...
The Coffee House Trader
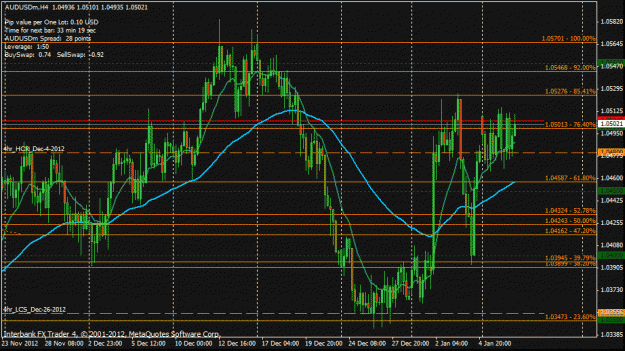
- cougar73 replied Nov 13, 2013
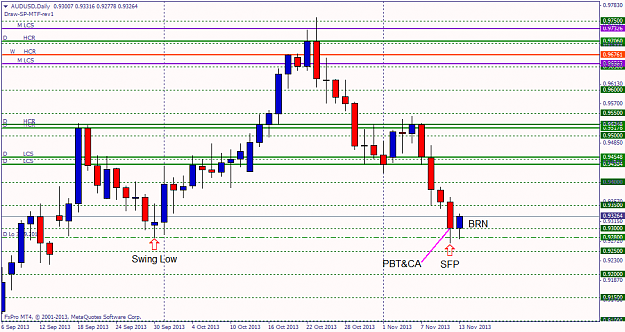
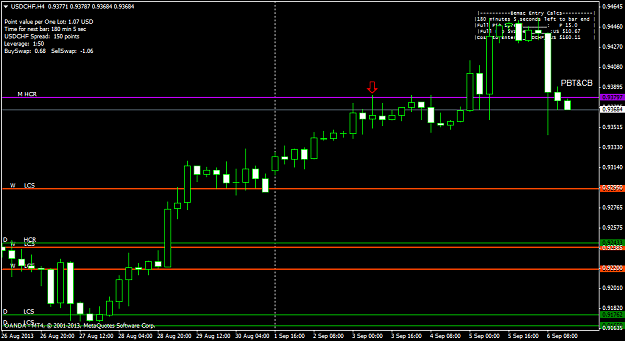
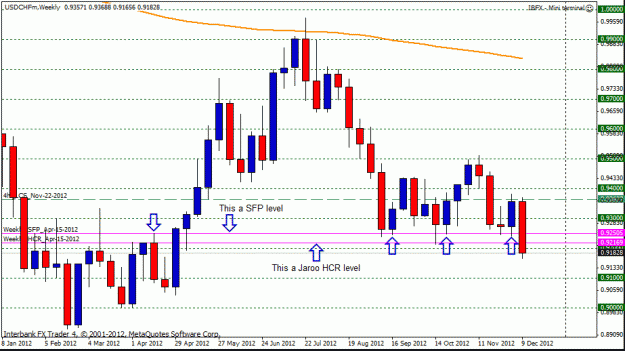
I'm not Jaroo (I wish he was still posting in the threads), but I'll give it a shot. We have a nice Swing Failure Point (SFP) trade using the Sept 30th Swing Low point. Yesterday price did a PBT&CA both the 0.9300 Big Round Number (BRN) and the Sept ...
james16 Chart Thread
- cougar73 replied Sep 8, 2013
I think OB was talking about his 1hr SFP that he took back on Aug-27. He had about 50 pips profit and was holding out for more. Maybe his TP was overly optimistic. image Regards, Eric.
james16 Chart Thread
- cougar73 replied Sep 8, 2013
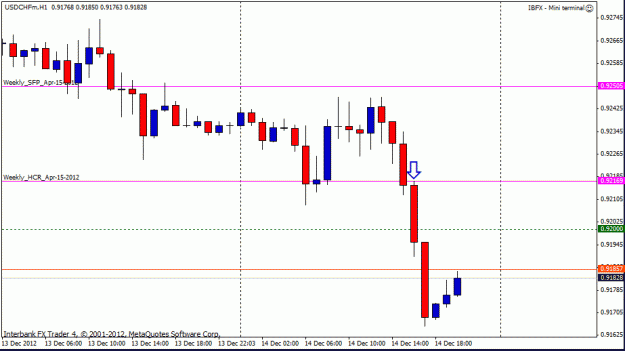
Hi Pinbar, Well...from a Jaroo point-of-view...shorts look to be good on UChf starting out the week. After the poor numbers for NFP on Friday, UChf Daily/4hr prices broke and closed below a Monthly HCR (HHR in here). Prices on the 4hr retraced back ...
Mastering the Art of Trading
- cougar73 replied Sep 4, 2013
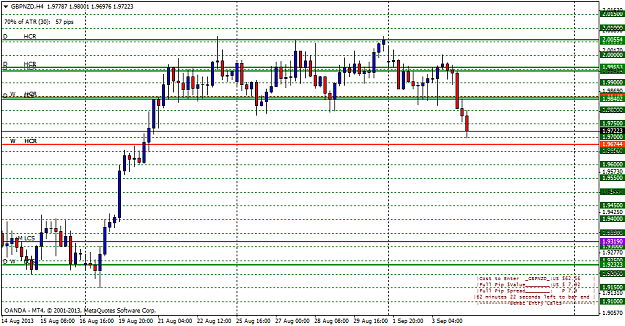
Another 4hr/Daily method similar to Jaroo...I'll play along. Here is a 4hr chart of GBP/NZD making some Southern Exposures off of the strong resistance. image Best, Eric.
Mastering the Art of Trading
- cougar73 replied Jan 22, 2013
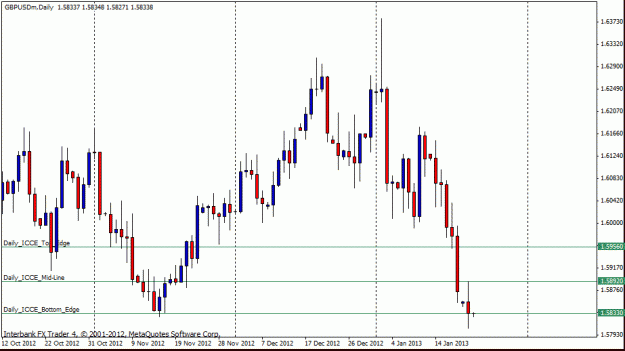
And back into the Channel Cable goes... Knowing where that 1.5833 rock is can come in handy. As with most Jaroo like entries and paying attention to where the Stops are likely to be placed...a 35 pip SL usually suffices. Regards, Eric.
Order Flow Trading with ICCE Channels
- cougar73 replied Jan 21, 2013
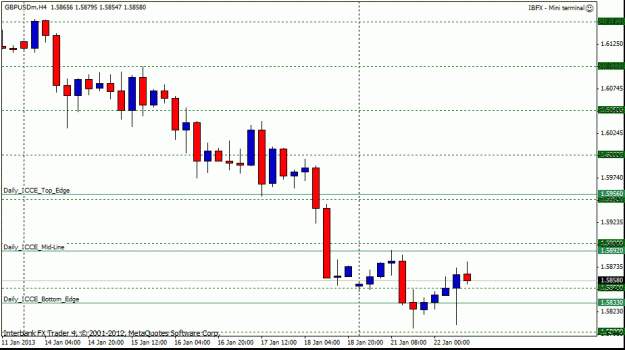
Here's the Cable chart without all of the other lines on it. Price has settled on the Bottom Edge for the moment. For future reference I'll call out the Top, Mid, and Bottom lines that I'm watching... Top 1.5956 Mid 1.5892 Bot 1.5833 This an area ...
Order Flow Trading with ICCE Channels
- cougar73 replied Jan 21, 2013
One of my favorite pairs is Pound Sterling/US Dollar (GBP/USD...or simply Cable). This is one of the 3 Kingdoms that fti talks of in his TAF thread...and it's a widely followed major pair. I like it because it moves, and anything that moves and has ...
Order Flow Trading with ICCE Channels
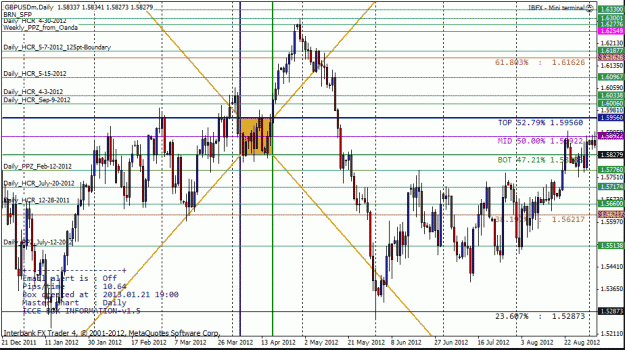
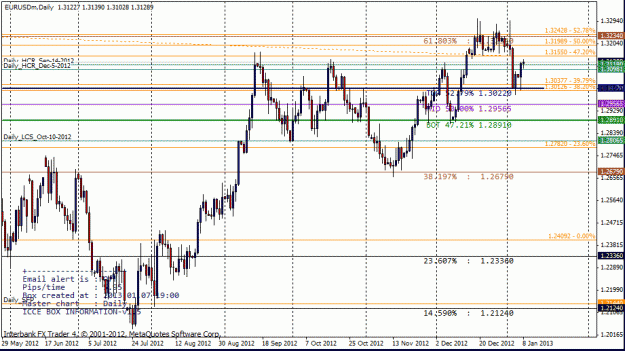
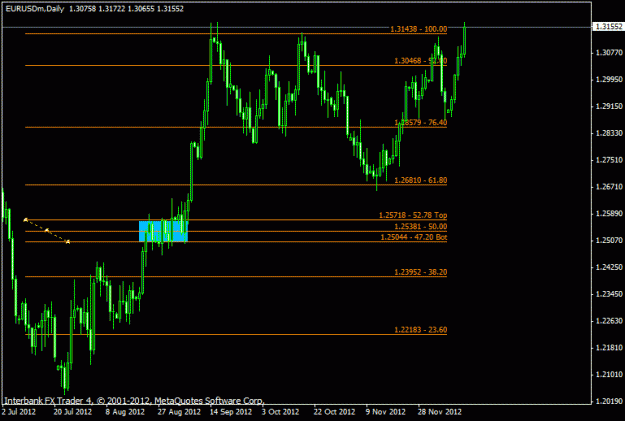
- cougar73 replied Jan 7, 2013
Back on Dec 6, I showed the EU Daily ICCE chart. Last Thursday (Jan 3) EU came back at re-tested the top of the ICCE Channel at 1.3022. I never intended this journal to be a signals calling area. More like a set of signposts of places that Price ...
The Coffee House Trader
- cougar73 replied Dec 21, 2012
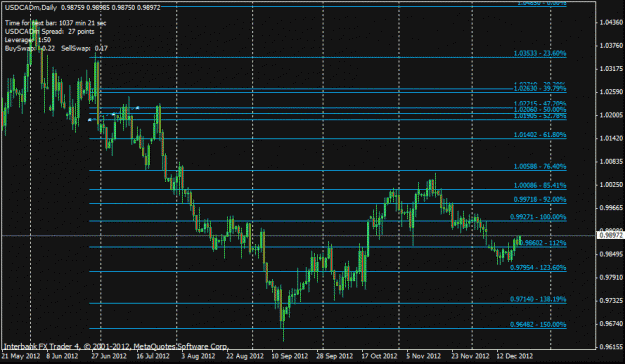
Here is my USD/CAD Daily chart that I have been watching. The ATR has slacked off lately. But lack of movement on a pair isn't the same as not being able to make money on it. You just can't make hundreds of pips on it...which isn't the same thing. ...
USD/CAD
- cougar73 replied Dec 21, 2012
I haven't really talked about UCad yet...which is one of the favorites for the folks who are trading on the NY session. UCad is most active (or to me it seems most active) when NY is cranked up. UCad is normally inversely correlated to the ...
The Coffee House Trader

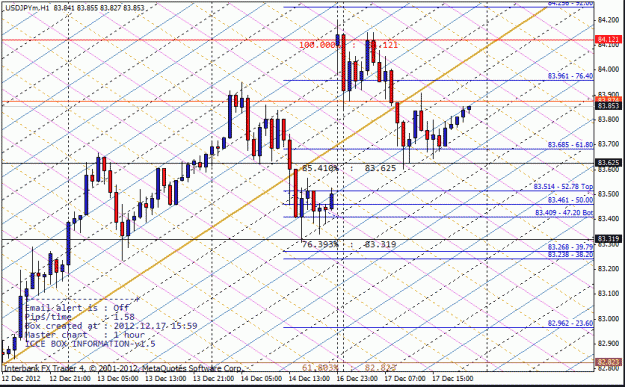
- cougar73 replied Dec 20, 2012
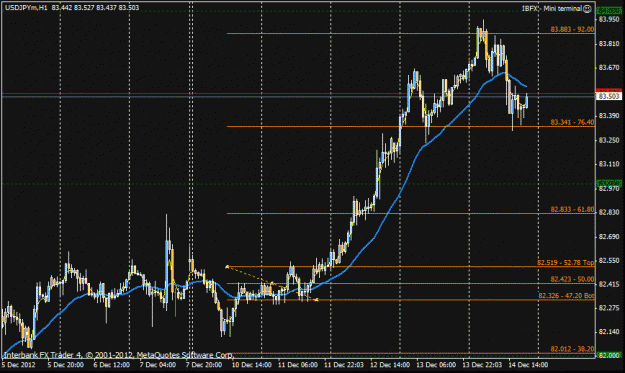
Hi Tom, One of your first posts on the thread on UJ (post 7) came back into prominence today at the 84.39 level. Price reacted to it and shied away. Have a Merry Christmas, Eric.
Fail Better
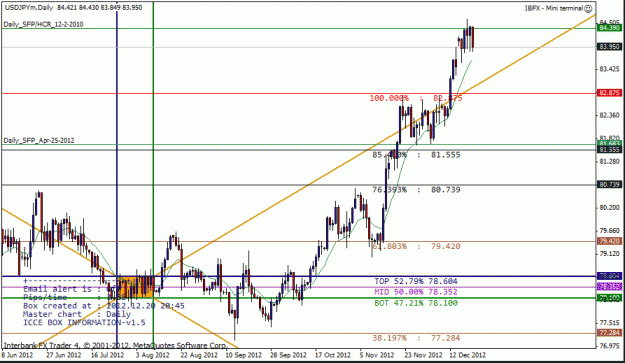
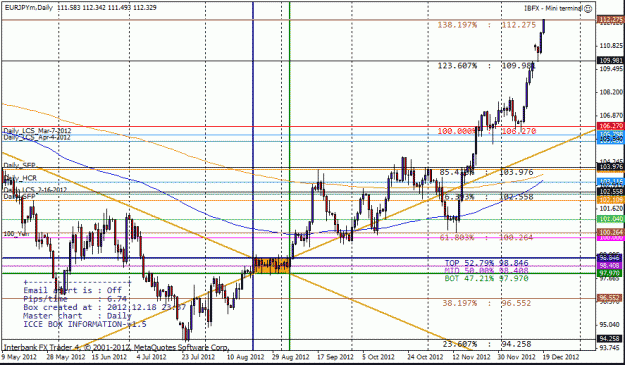
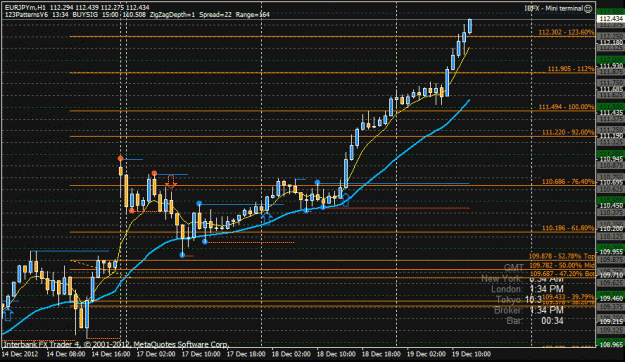
- cougar73 replied Dec 19, 2012
Part of my development as a trader is to pay attention to world events and see how they tie in to what is going on with EuroYen. The EuroYen (EJ) pair seems to be a barometer for market sentiment. When the Smart Money is worried about the USA ...
The Coffee House Trader
- cougar73 replied Dec 17, 2012
To go along with what One Day said before about turning on the diagonals...well, there is another level that you can turn on called Mid-Daigonals. And these put nice little dotted lines in-between the Bullish and Bearish diagonals. I like to turn ...
The Coffee House Trader
- cougar73 replied Dec 17, 2012
In defence of One Day's idea that having the diagonals left on is a good thing... ...I did another UJ chart on the 1hour time frame and left the diagonals turned on. The Blue lines running up towards the upper right are Bullish Defensive Lines. And ...
The Coffee House Trader
- cougar73 replied Dec 16, 2012
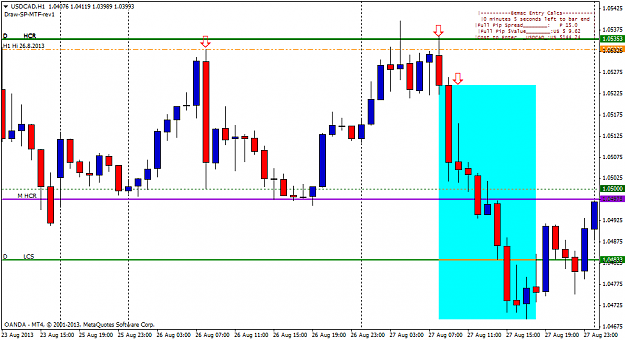
Well, you're right that (0.9266) is a Jaroo level. That's not the only one this week where PBT&CB. It also broke through 0.9216 (that I had on my original chart as a HCR)...and then retraced back to it almost to the pip...before continuing on down. ...
The Coffee House Trader
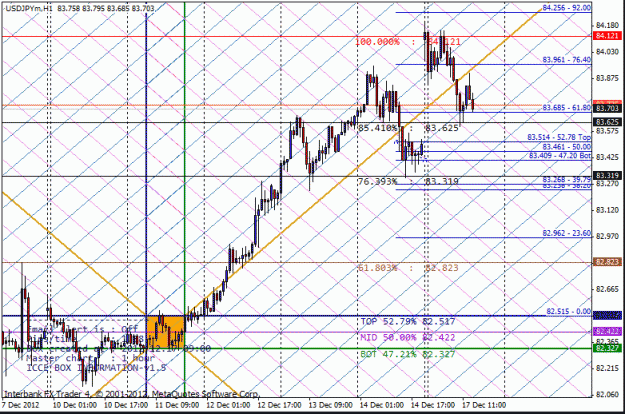
- cougar73 replied Dec 15, 2012
Not everyone trades the Daily time frames. I like to see the trends from the Daily, but then drop down to the Hourly to see where the potentials for the upcoming week may be. Once you have Price Actions wandering around inside a tight channel...it's ...
The Coffee House Trader
- cougar73 replied Dec 14, 2012
The best use of the ICCE indicator is that it helps you to look for future Price Actions in Great spots. If you can define a Congestion or Compression area as a Channel that has a Top and a Bottom...that are being used as both Support and Resistance ...
The Coffee House Trader
- cougar73 replied Dec 10, 2012
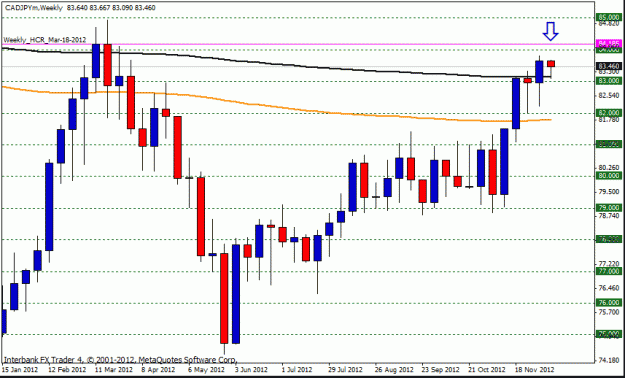
Hi Pinbar, Were you thinking of a CadJ bounce off of the Weekly HCR...or a level off of the monthly? Best, Eric.
james16 Chart Thread