


BITCOIN FORECAST: BTC PRICE ECLIPSES $10,000 – WILL THE CRYPTO RALLY CONTINUE OR REVERSE?
- Bitcoin has skyrocketed nearly 50% year-to-date after holding a critical technical support level
- BTC price action has potential to continue its advance after the crypto-currency topped the psychologically-significant $10,000 mark, but a broader downtrend
- Check out this article on Bitcoin Day Trading for key insight on BTC trading strategies
Bitcoin prices have soared 60% since printing its December 18 swing low and puts the crypto-currency on pace to be the best performing asset year-to-date as it was in 2019.
I highlighted Bitcoin two months ago as a candidate for potential 2020 breakout trades, but can BTC price action prolong its upward ascent after climbing back above the $10,000 handle?
BITCOIN PRICE CHART (BTC/USD): WEEKLY TIME FRAME – OCTOBER 2017 TO FEBRUARY 2020
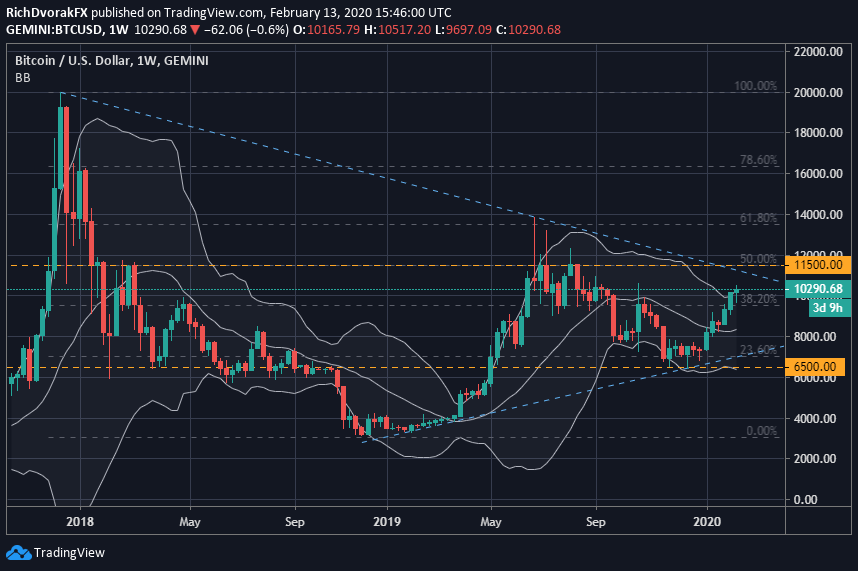
Chart created by @RichDvorakFX with TradingView
The zone of technical resistance around $10,000 is underscored by the late-October highs recorded last year.
This area of confluence is also highlightedby the 38.2% Fibonacci retracement of its trading range since the blow-off top late 2017 and is detailed on the weekly Bitcoin chart above.
With the 10K level now in the rearview, the price of bitcoin could continue marching higher toward its next potential resistance level near the $11,500 mark.
Learn More: What is Bitcoin and How is Bitcoin Price Action Affected?
Though BTC price action is riding the upper barrier of its Bollinger Band ™ and may present an obstacle for Bitcoin bulls. An extended rally in BTC might be hindered by a Bollinger Band ™ squeeze in particular.
Also, the downward-sloping trendline connecting the December 2017 and June 2019 peaks printed by Bitcoin could also send the crypto-currency pivoting back lower.
BITCOIN PRICE CHART (BTC/USD): DAILY TIME FRAME – AUGUST 2019 TO FEBRUARY 2020
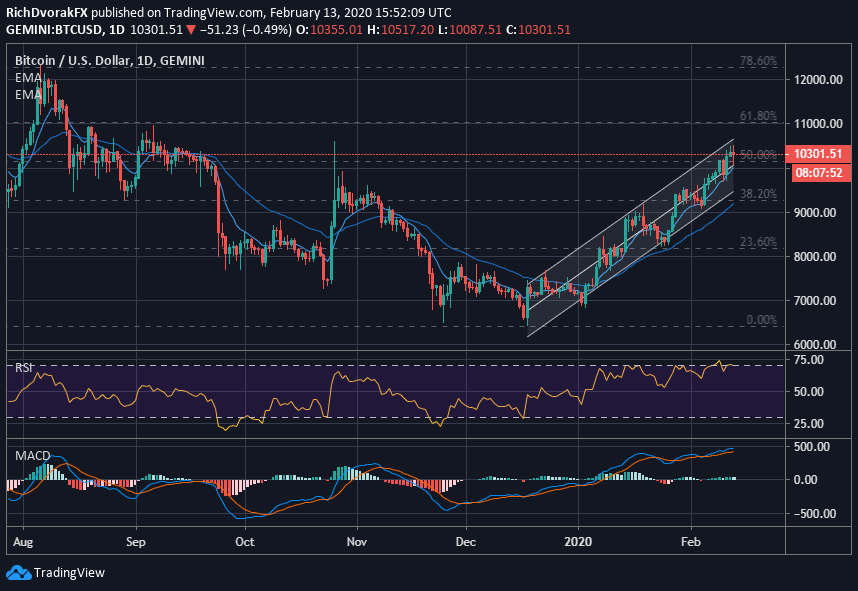
Chart created by @RichDvorakFX with TradingView
Nevertheless, a daily Bitcoin chart brings to light the bullish channel seemingly etched out by BTC prices since bouncing off the December 2019 low.
The short-term and medium-term exponential moving averages (9-day and 34-day EMAs shown above), in addition to the red-hot relative strength index, emphasize the healthy uptrend recently recorded by Bitcoin as well.

Upward momentum – as indicated by the MACD – may be showing preliminary signs of waning, however. That said, negative divergence on the RSI is lacking and suggests that Bitcoin strength may linger (at least for now).
On another note, BTC price action might focus less on technical and more on fundamental drivers.
Perhaps ongoing coronavirus concern will contribute to an impending emerging markets crisis and help bolster crypto-currencies considering Bitcoin price correlations with EM FX – specifically spot USD/CNH.
Keep Reading: Top 5 Emerging Market Currencies & How to Trade Them
-- Written by Rich Dvorak, Junior Analyst for DailyFX.com
Connect with @RichDvorakFX on Twitter for real-time market insight


