

After spending a week on the bullish run, Bitcoin faced a severe downfall which left the market confused. After trading at the monthly high of almost $11,000, Bitcoin suffered a hard fall down the charts.
The trading price reached $10,900 and the very next day the price came down to $10,230 on 7th September. A slight bullish push in the market was seen the next day, but another wave of downward correction took the price to close to $10,100 support levels.
Today the day started at $10,316.03, and since then a downward correction can be seen in the price. The downward trend is moving quickly as the price is moving towards the support level of $10,100.
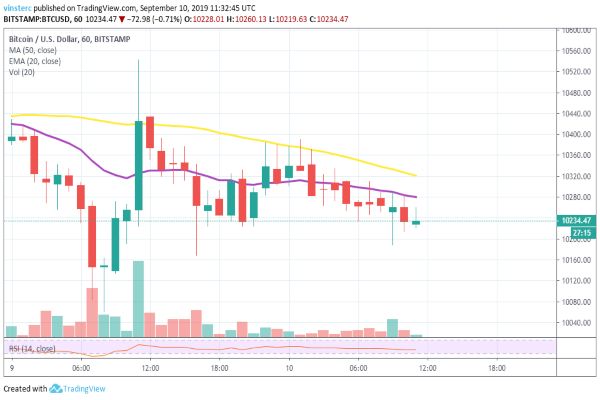
Currently, Bitcoin is trading at $10,234.47 as it goes further down. The moving averages are facing downwards, and a downward correction is taking the price to the support levels of $10,100. Strong resistance can be seen forming near the level of $10,300 with the major resistance forming at $10,500.
On the other hand, a support level can be seen, forming near the $10,150 and $10,100 levels. If the downward trend continues and the bulls are not able to defend the place, we can expect a further bearish pull. The bears can pull the price down, making it test the support levels of $10,050 and $10,000.
ETH/USD
As Bitcoin faced a downward correction in the charts, things were different for Ethereum. Earlier Ethereum was trading well below $178 resistance levels, but with the beginning of the new week, Ethereum got a bullish push, and the price broke free from the resistance levels of $178.
Ethereum price surged well above the major resistance level of $182, and it moved further towards the $185 significant resistance, but it couldn’t pass that.

Currently, ETH is trading at $181.44 as strong resistance forms near $184 level. Immediate support can be seen, forming at $179 as the price continues to move towards the resistance level of $184. If the trend continues, we can expect the price to rally towards the resistance levels of $188. If things go the other way, we can expect the price to test the support levels of $175 and $172.
XRP/USD
After spending a week with the bears, Ripple finally had a good start for the next week as the price saw an upward trend in the charts.
Ripple started trading at the price of $0.2611 on 8th September, and since then it has seen a wave trend formation in the price. A slight downward correction can be seen in the chart now and then, but the trade line is moving parallelly with the moving averages.
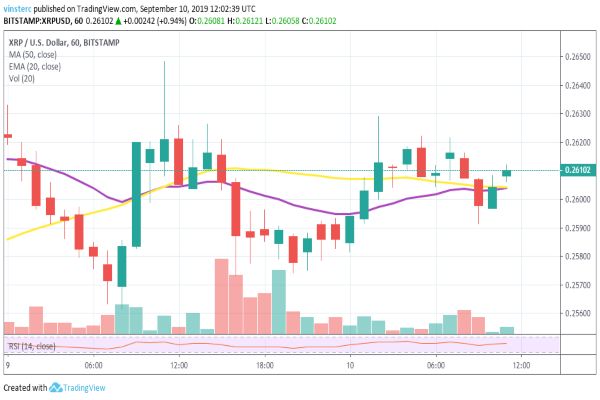
Currently, XRP is trading at $0.2610 with an immediate support level present at $0.2581, and strong resistance can be seen near the $0.2630 level. XRP is trying hard to push through the resistance level and move in the direction of the major resistance of $0.2700.
If a downward trend enters the charts, we can expect the price to test the support levels of $0.2550 and $0.2500. A bullish pattern can be seen forming by the charts so we can expect the price to go further towards the immediate resistance level.
LTC/USD
As Bitcoin faces a downward correction in its price, the other digital currencies are seeing an upward trend in the charts. LTC spent the first week of September struggling and trying to break the resistance levels of $70.
The second week, however, changed things for Litecoin as it saw a bullish trend in the charts and the price went upwards till $72.39 before facing a slight downward correction.

Currently, LTC is trading at $71.16 with a strong resistance present at $73 and immediate support forming at $69. A bullish trend can be seen forming in the charts as the moving averages are moving upwards slowly. Major resistance is available at $75, and LTC is trying hard to breakthrough.
In case a downward correction is seen, the bears can take the price down, and support levels of $69 will be reached. If the bulls are not able to defend this position, we can further expect the price to go down to $67 and $65.
BCH/USD
It looks like, except Bitcoin, every other digital currency is having a good week as the charts show a bullish trend in every cryptocurrency. Bitcoin Cash faced a downward correction around 7th-8th Septemeber.
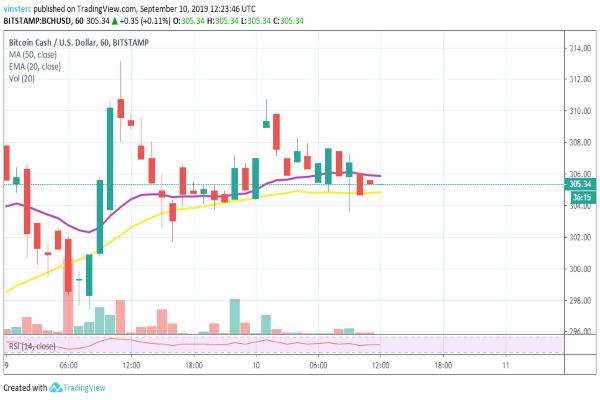
Since then, BCH has seen a wave pattern forming within the charts as the price continues to move upwards. BCH is currently trading at $305.34 between both the moving averages. Strong resistance can be seen at $307 with major resistance forming at $310.
Support levels are forming near the $303, and it is trying hard to move in the upward direction. A robust bullish push can take the price above the resistance level of $310 and further towards the major resistance of $315. If downward correction occurs, we can expect the price to go down towards the $303 and $300 levels. Any decline further can test the support levels of $298 and $295.


