Litecoin Price Analysis LTC / USD: Preparing For Hibernation
Litecoin has shifted its dynamic and starts posting lower highs and lows.

Share this article
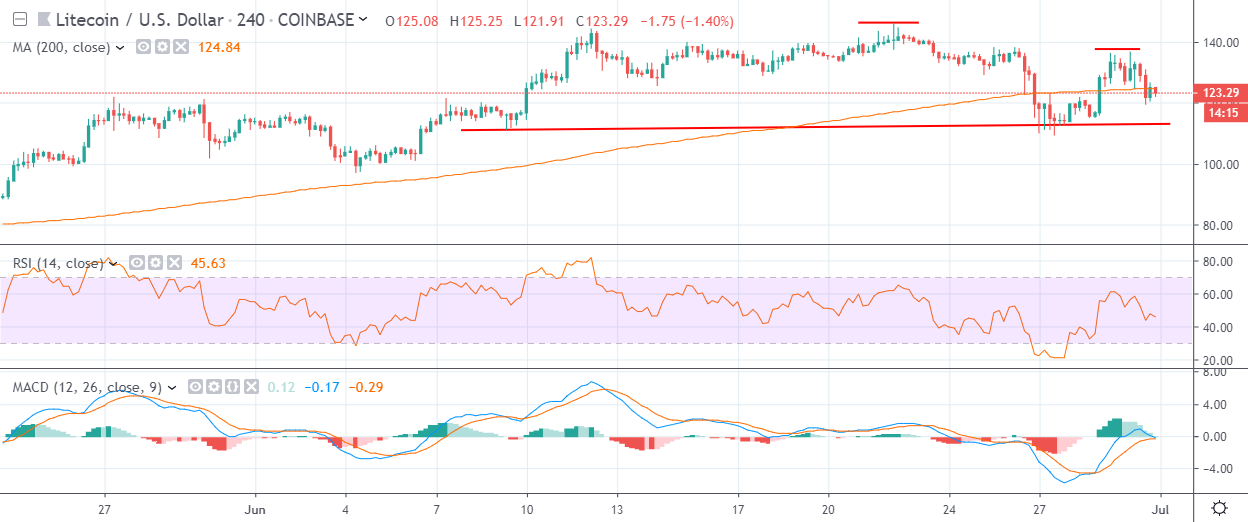
- Litecoin has a bearish short-term trading bias, with cryptocurrency appearing increasing weak below its 200-period moving average on the four-hour time frame
- The four-hour time frame is showing that a bearish head and shoulders pattern has formed
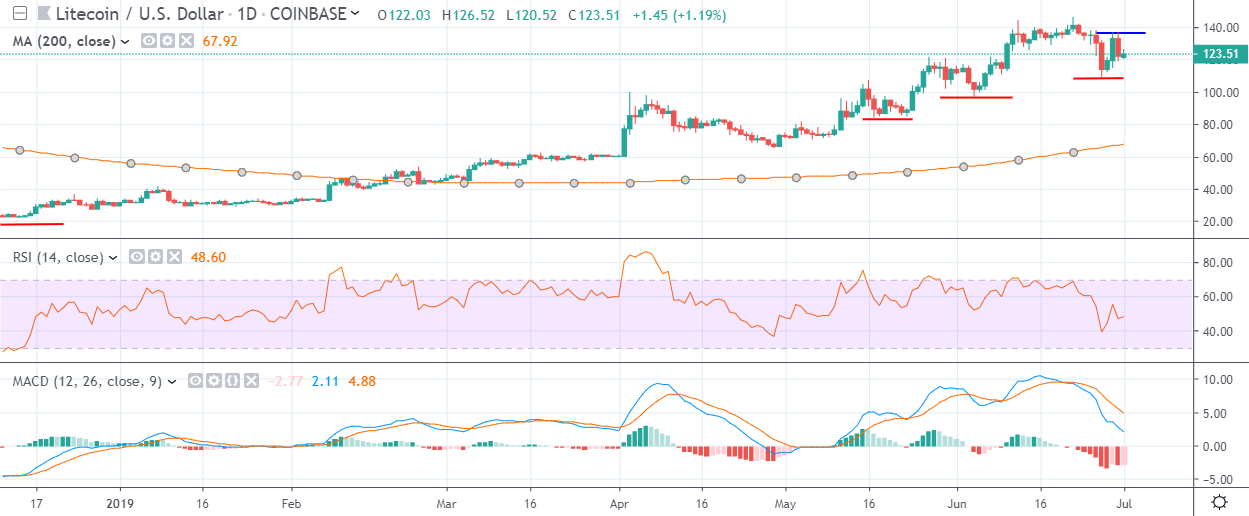
- The daily time frame highlights that the LTC / USD pair is now making lower highs and lower lows
Litecoin / USD Short-term price analysis
Litecoin has a bearish short-term trading outlook, with the LTC / USD pair appearing increasingly weak below its 200-period moving average on the four-hour time frame.
The four-hour time frame is showing that the recent decline in the cryptocurrency has helped to create a large head and shoulders pattern, with the LTC / USD pair hovering around neckline support.
Technical indicators on the four-hour time frame are bearish and continue to provide a strong sell signal.
Pattern Watch
Traders should note that the bearish head and shoulders pattern on the four-hour time frame has a downside projection of around $40.00.
Relative Strength Index
The Relative Strength indicator on the four-hour time frame is bearish and is now trading in oversold territory.
MACD Indicator
The MACD indicator is bearish on the four-hour time frame and continues to generate a clear sell signal.
Litecoin / USD Medium-term price analysis
Litecoin has a bullish medium-term trading bias, with the cryptocurrency still trading well above its trend-defining 200-period moving average.
The daily time frame shows that a technical shift has now occurred, with the cryptocurrency now creating bearish lower highs and lower lows. Key technical support for the LTC / USD pair is currently found at the $100.00 and $84.00 levels.
Technical indicators are turning lower and continue to issue a bearish trading signal on the daily time frame.
Pattern Watch
Traders should note that a bearish triple-top pattern formation is also in play on the daily time frame.
Relative Strength Index
The Relative Strength indicator on the daily time frame is turning lower and continues to generate a bearish trading signal.
MACD Indicator
The MACD indicator is bearish on the daily time frame, with both the MACD signal line and histogram issuing a sell signal.
Conclusion
Litecoin is undergoing technical selling back towards the $100.00 support level, with the bearish pattern on the four-hour time frame pointing to a potential drop towards the $60.00 level.
The dynamics have also shifted on the daily time frame, which may place the LTC / USD pair’s 200-day moving average back in focus over the medium-term.
Check out our coin guide for an introduction to Litecoin.
We also wrote a DARE for the project, analyzing the future prospects of the Bitcoin competitor.
Share this article
