

LTCUSD Dominant Trend: Bullish
Resistance Levels: $150, $160, $170
Support Levels: $125, $115, $105
Litecoin Price Analysis
Litecoin (LTC), the fourth largest cryptocurrency market, continues its positive trend after a stable Wednesday. Litecoin price has grown more than 3% in the last 24 hours, which shows that investors are paying close attention to its upcoming halving. The digital currency has seen the greatest growth among the 30 main digital assets. Litecoin price faced several technical scenarios on Wednesday. Initially, there was a break with the downward trend after the gains of Bitcoin’s recent momentum reached a $140 hurdle. Litecoin price tested levels below $130 and formed a floor at $128.95. The breakout of the wedge pattern further pushed the reversal above the 50-day moving average. The LTC/USD gains tested the $140 level for the second time in four days. The sellers’ disorder ($140) blocked the area, preventing the movement from moving north. As a result, the formation of a double-top pattern on the 4-hour chart pushes Litecoin price toward short-term support of $134. But before that, the trend line will try to stop the falls.
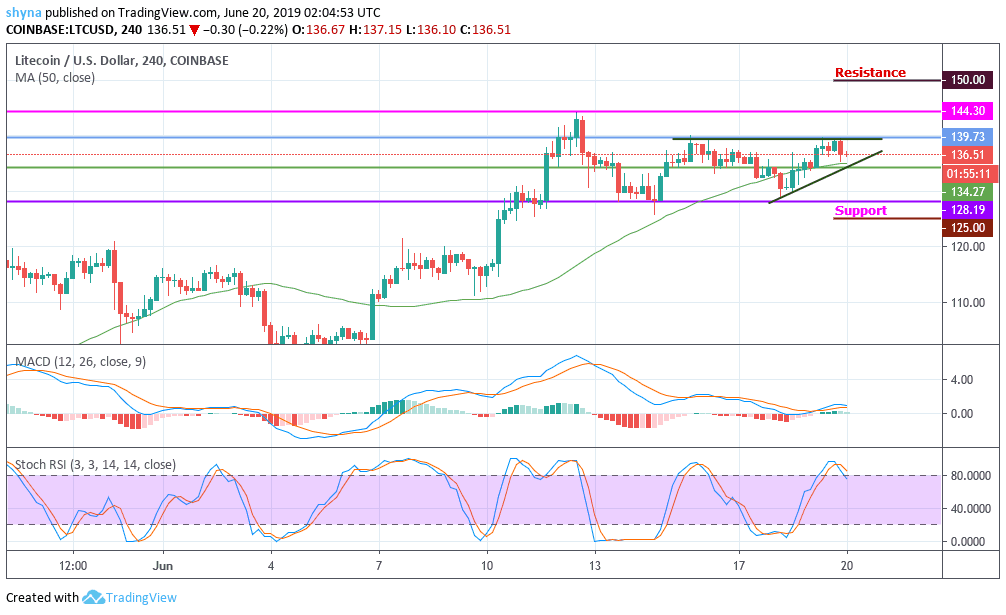
In addition, the Litecoin price was negotiated in the symmetrical triangle and above the green line of the moving average with a period of 50, which indicates that if the price breaks and crosses the upper channel of the symmetric triangle, it is likely to give way to bullish trends. At the moment, the market price fluctuates in the middle part of the channel. Following the symmetric triangle, Litecoin price experienced a significant increase, as the market remained around the upper channel for the past two days, which has now formed a double-top pattern as said earlier. This trend could drive the market to break with resistance levels of $150, $160 and $170. The MACD seemed to take off, bringing green bars, but mere looking at the stochastic RSI, we can simply notice that the market is currently in the field of overbought, while it is about to collapse. Potential supports to watch are at $125, $115 and $105. As it has appeared in the mid-term trend, the bulls are taking control of the market.


