

Bitcoin Cash Price (BCH): Trends and Highlights for June 10, 2019
- BCH/USD reached a top on June 5.
- The BCH price is trading inside a symmetrical triangle.
- It is trading inside a long-term ascending channel.
- Short-term indicators are bullish.
- Long-term indicators are bearish.
- There is support near $350.
Symmetrical Triangle
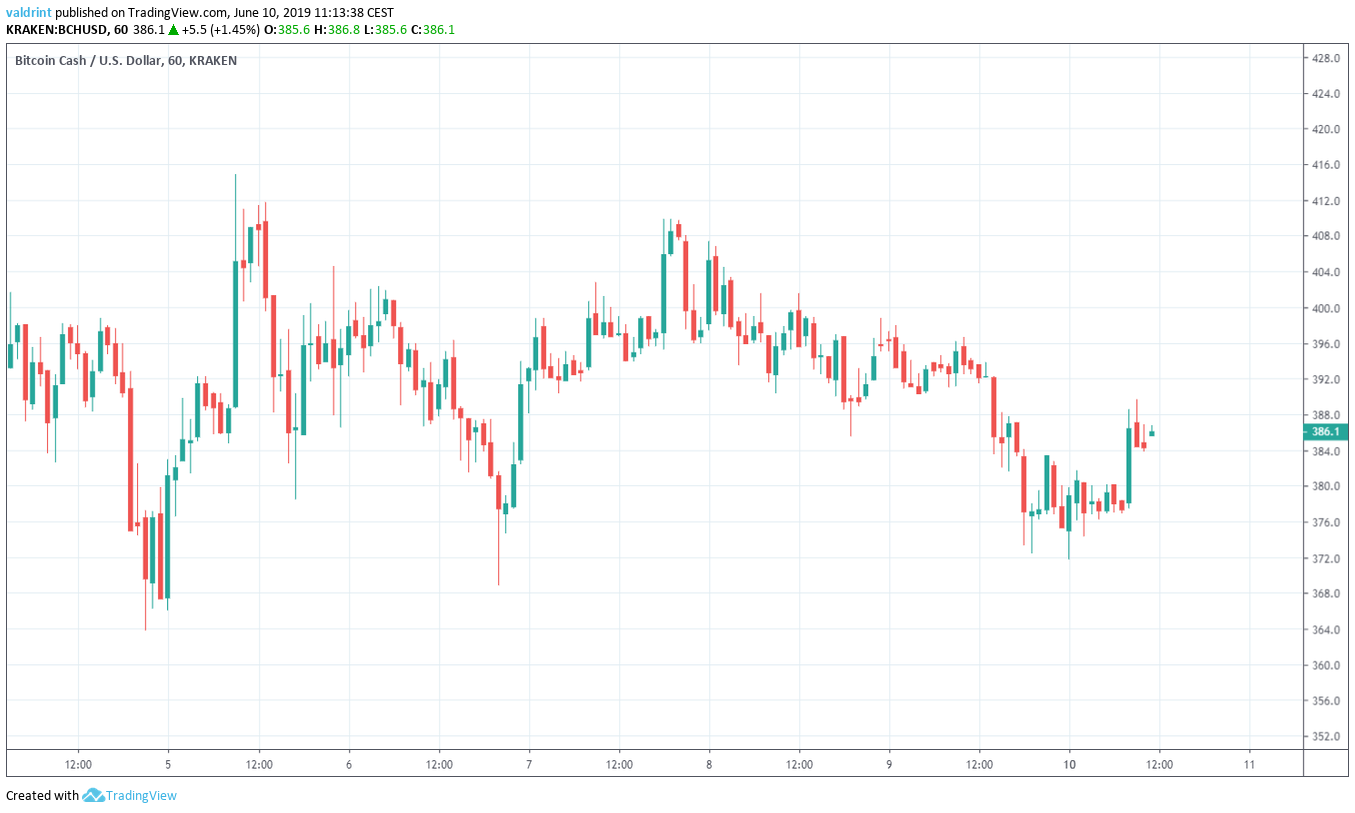
On June 4, the Bitcoin Cash price (BCH) reached a low of $363.8. An upward move began. The next day, the price reached a high of $414.9.
Since then, it has been trading inside the symmetrical triangle outlined below: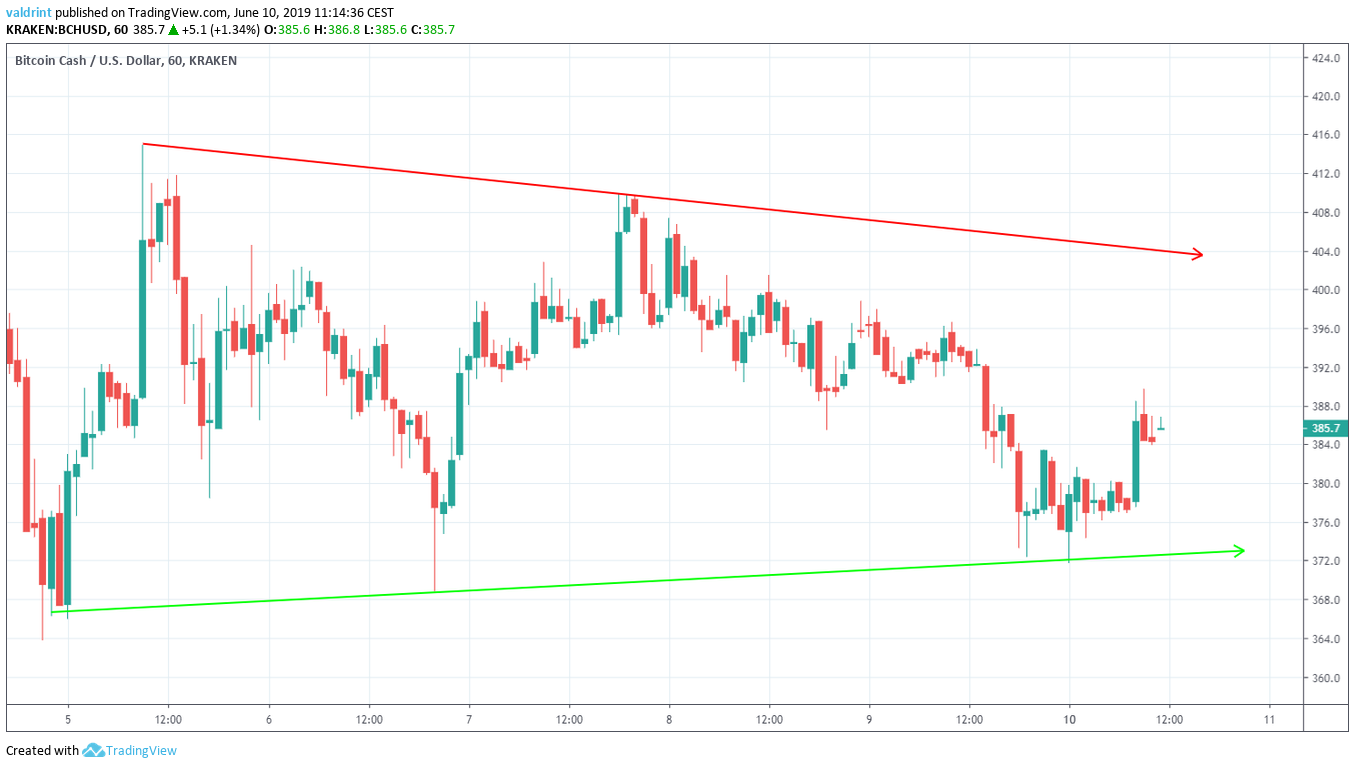
On June 10, the BCH price touched the support line of the triangle. An upward move began.
Where is it heading next? A look at technical indicators is required in order to find out.Bitcoin Cash Price: Technical Indicators
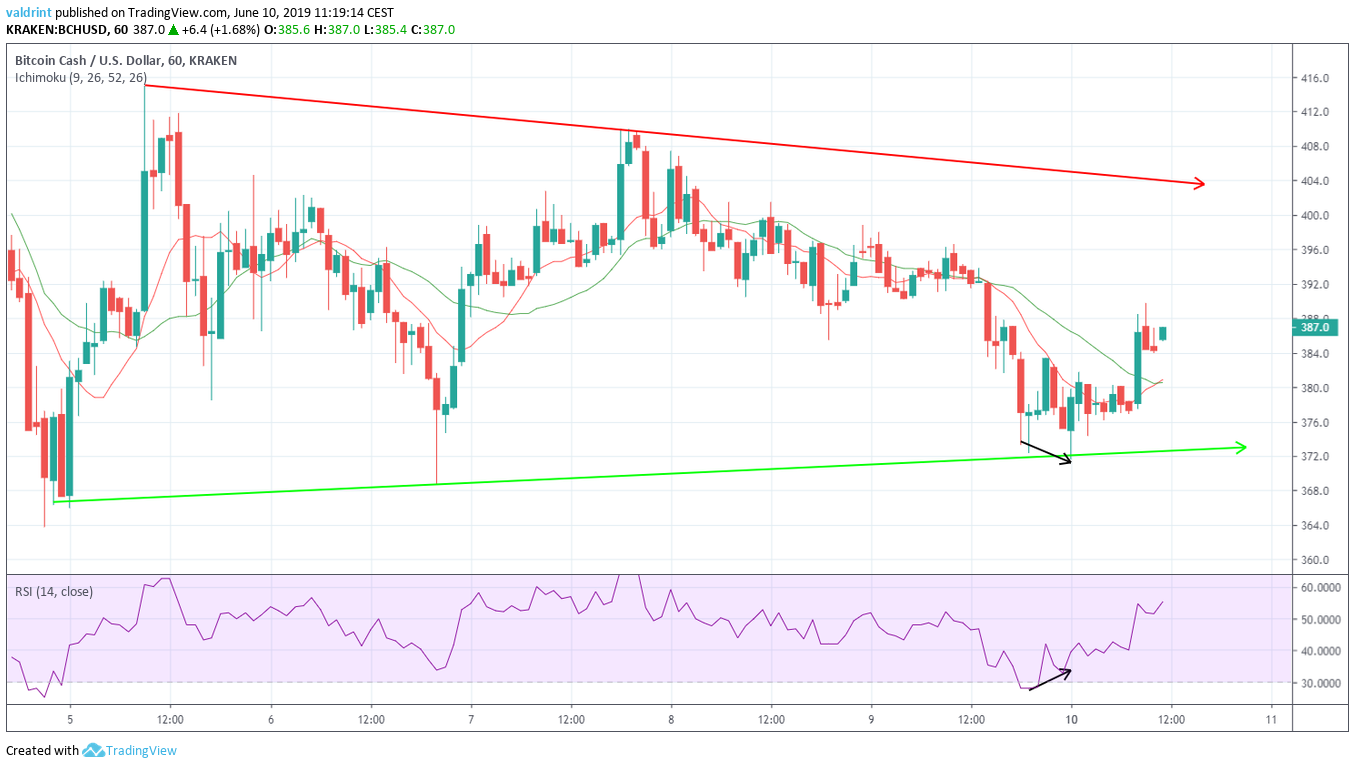 In the case of BCH, it preceded the bounce from the support line.
On June 10, a bullish cross occurred between the 10- and 20-period moving averages.
The use of these indicators supports an upward move towards the resistance line of the channel.
However, an analysis of the same indicators in a daily time-frame gives a very different outlook:
In the case of BCH, it preceded the bounce from the support line.
On June 10, a bullish cross occurred between the 10- and 20-period moving averages.
The use of these indicators supports an upward move towards the resistance line of the channel.
However, an analysis of the same indicators in a daily time-frame gives a very different outlook:
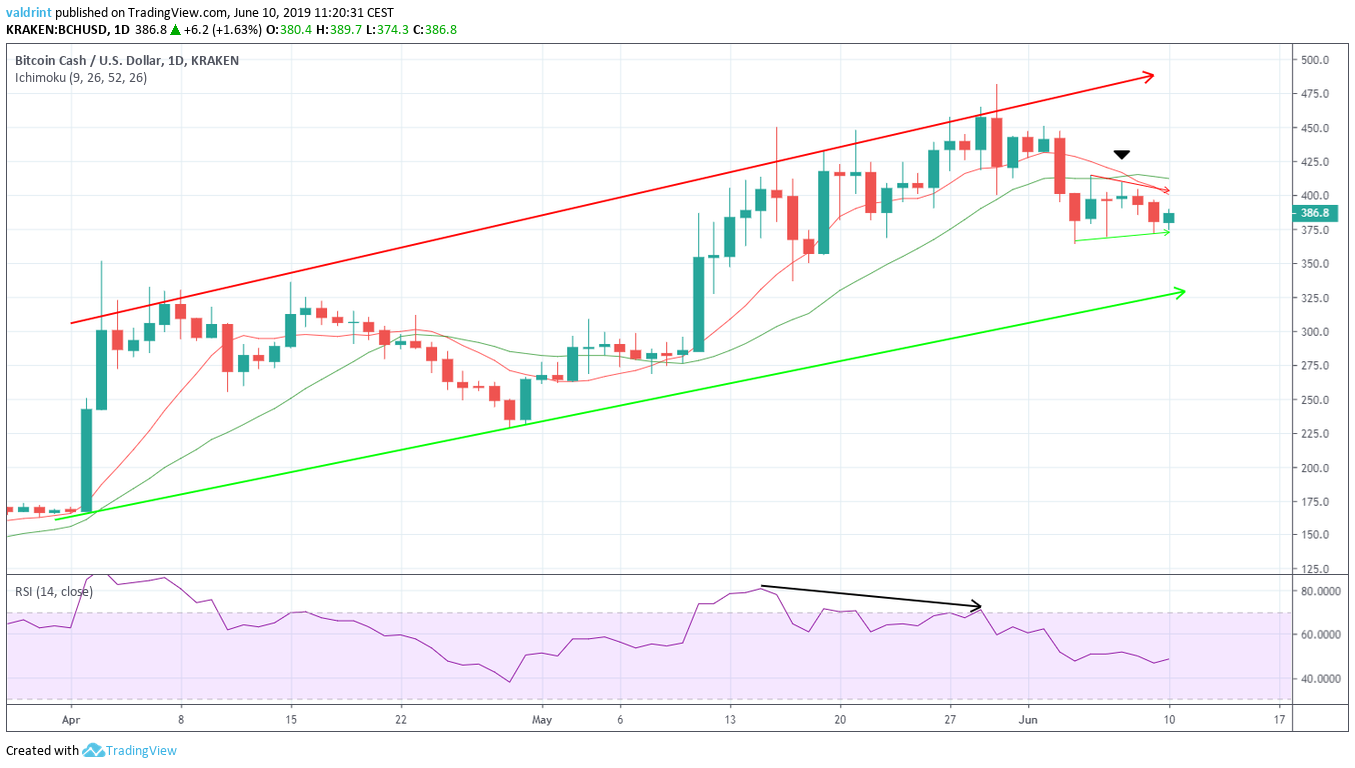 Firstly, we can see that the price has been trading inside an ascending channel since Apr 4. Furthermore, the RSI has been generating bearish divergence since the highs reached on May 15.
Finally, a bearish cross between the 10- and 20-day MAs occurred on June 7. The 10-day MA has been providing close resistance to the price since.
The use of these indicators makes a breakout from the short-term triangle unlikely. Rather, we would expect the price to eventually reach the support line of the long-term channel.
Firstly, we can see that the price has been trading inside an ascending channel since Apr 4. Furthermore, the RSI has been generating bearish divergence since the highs reached on May 15.
Finally, a bearish cross between the 10- and 20-day MAs occurred on June 7. The 10-day MA has been providing close resistance to the price since.
The use of these indicators makes a breakout from the short-term triangle unlikely. Rather, we would expect the price to eventually reach the support line of the long-term channel.
Reversal Areas
One support area is traced for BCH/USD below: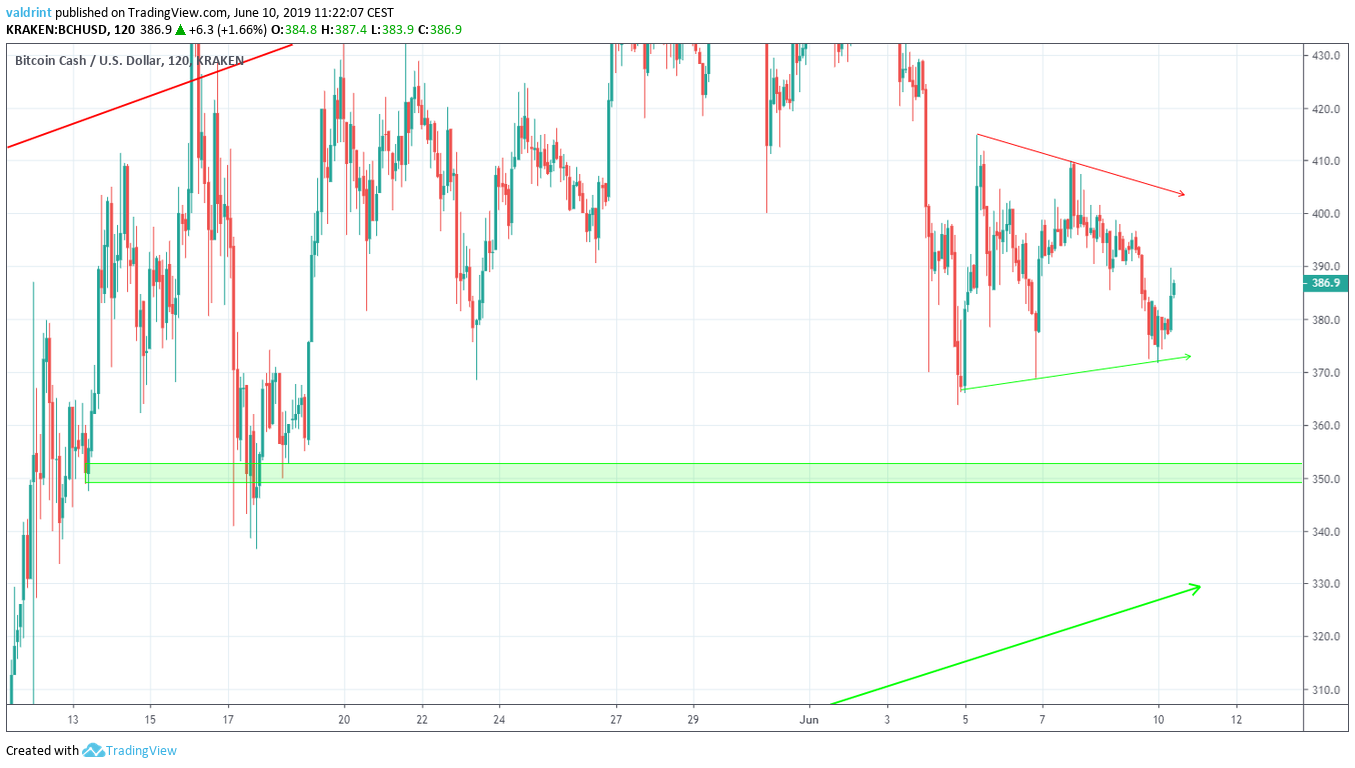
The closest support area is found near $350. If the Bitcoin Cash price breaks down from the triangle, it is likely to provide a reversal. The analysis of technical indicators supports a short-term increase towards the resistance line of the triangle. However, a breakdown is likely in the long-term.
Summary
The BCH price is trading inside a short-term symmetrical triangle and a long-term ascending channel. The short-term indicators are bullish while the long-term ones are bearish. They support an upward move towards the resistance line of the triangle before an eventual breakdown occurs.Do you think the Bitcoin Cash price will break down from the triangle? Let us know your thoughts in the comments below.
Disclaimer: This article is not trading advice and should not be construed as such. Always consult a trained financial professional before investing in cryptocurrencies, as the market is particularly volatile.
Trusted
Disclaimer
In line with the Trust Project guidelines, this price analysis article is for informational purposes only and should not be considered financial or investment advice. BeInCrypto is committed to accurate, unbiased reporting, but market conditions are subject to change without notice. Always conduct your own research and consult with a professional before making any financial decisions. Please note that our Terms and Conditions, Privacy Policy, and Disclaimers have been updated.
