


 Ethereum technical analysis against Bitcoin and USD suggest a strong uptrend may come next week
 🚨 This article is 5 years old...
Ethereum technical analysis against Bitcoin and USD suggest a strong uptrend may come next week
4 min read
Updated: Dec. 3, 2019 at 7:58 pm UTC

Cover art/illustration via CryptoSlate. Image includes combined content which may include AI-generated content.
As the market continues to climb on its rally from December lows, several of the high cap coins have been noticeably quiet—including Ethereum. However, Bitcoin’s recent price surge saw its price increase nearly 50 percent in two days, giving Ethereum and other high-caps the boost they needed to start their climb upwards.
This article will evaluate three separate aspects of Ethereum price movement, including ETH/USD, ETH/BTC and ETH.D (overall market dominance). In summary, the aim is aim to evaluate the next few periods of price action for Ethereum, which on the higher timeframes will provide about two to four weeks of what to expect, given the current market scenarios.

Several things come to mind when thinking about Ethereum and its future, although if there is one thing that crypto space seems appears to be incredibly quiet about, it is the enterprise, institutional, and corporate application of Ether.
The interest in ‘Enterprise Ethereum’ networks that are in development at Amazon, JP Morgan Chase, Microsoft, and other corporations show promise. This alone makes ETH an incredibly strong player for renewed momentum in the markets, and for that reason, technical analysis can prove insightful.
Fundamental and Technical Analysis
Oftentimes, crypto debates stem from the ideological differences between fundamental analysis (FA) and technical analysis (TA). Many feel that a ‘successful’ trader needs to decide on one of these two approaches. However, when used together, each adds a considerable amount of value, especially when considering that finance experience differs from person to person. The distinction between the two: FA suggests what to invest in, while TA suggests when to invest.
All things considered, the analysis provided here is suggesting that ETH will regain the market dominance it previously had, which is also good news for other altcoins.
A few notes here on the ETH.D chart from above, which illustrates the market cap size of Ether relative to the rest of the market. Clearly trending downward and sitting at approximately 10 percent, the higher frames like this still suggest downtrend continuation as the higher frames take longer to show emerging trends that are in play on the lower levels.
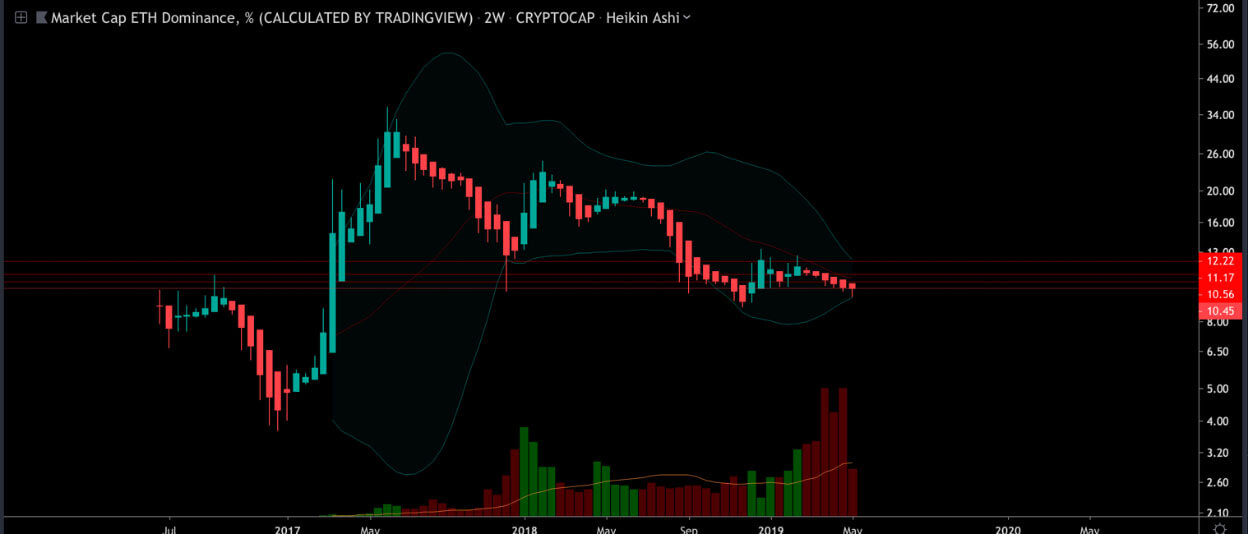
That said, 12 percent dominance, and 14 percent appear to be the next resistance that the ETH cap will face, assuming it continues upwards in its battle. The angle that the Bollinger bands are taking downward with the price is knowns as the squeeze. Since the bands are based on volatility, the fact that they are so consolidated at this point on such a high time frame suggests that the move that is incoming could be extremely explosive, as the squeeze from this is set up nicely.
To supplement that bullish bias, the BTC.D chart is also shown below and appears to be shifting slightly downward just as ETH.D appears to be breaking to the upside. This, of course, makes sense on the Bitcoin dominance side of the equation, because Bitcoin almost doubled in value and went straight up in market dominance, which peaked at roughly 63 percent at that time. Notice that while Bitcoin dominance was climbing Ether dominance was dropping.
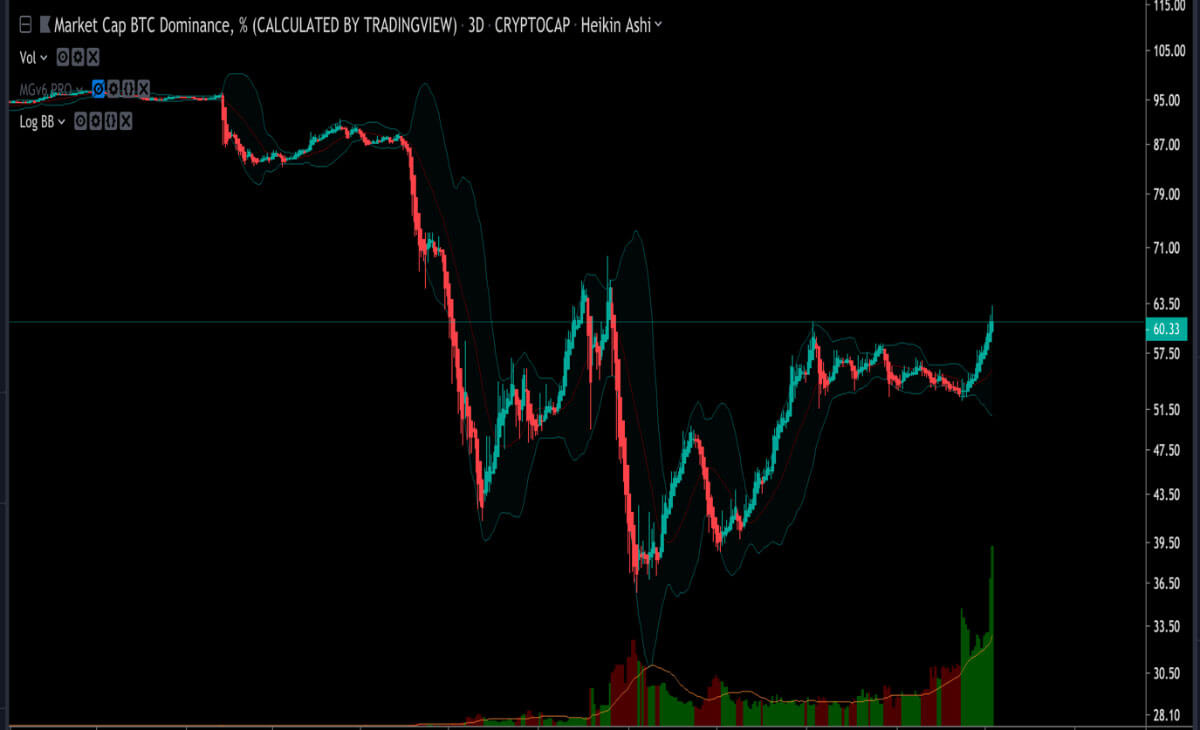
Taking what we already know from these charts, we can see ETH.D and BTC.D are inversely correlated. This in mind, we pivot over to the ETH/BTC chart in which we see a similar situation. Ethereum is far from is its all-time high in BTC but has a kick of life coming into play, as of today, as it touches a major support zone on the bottom of its low range.
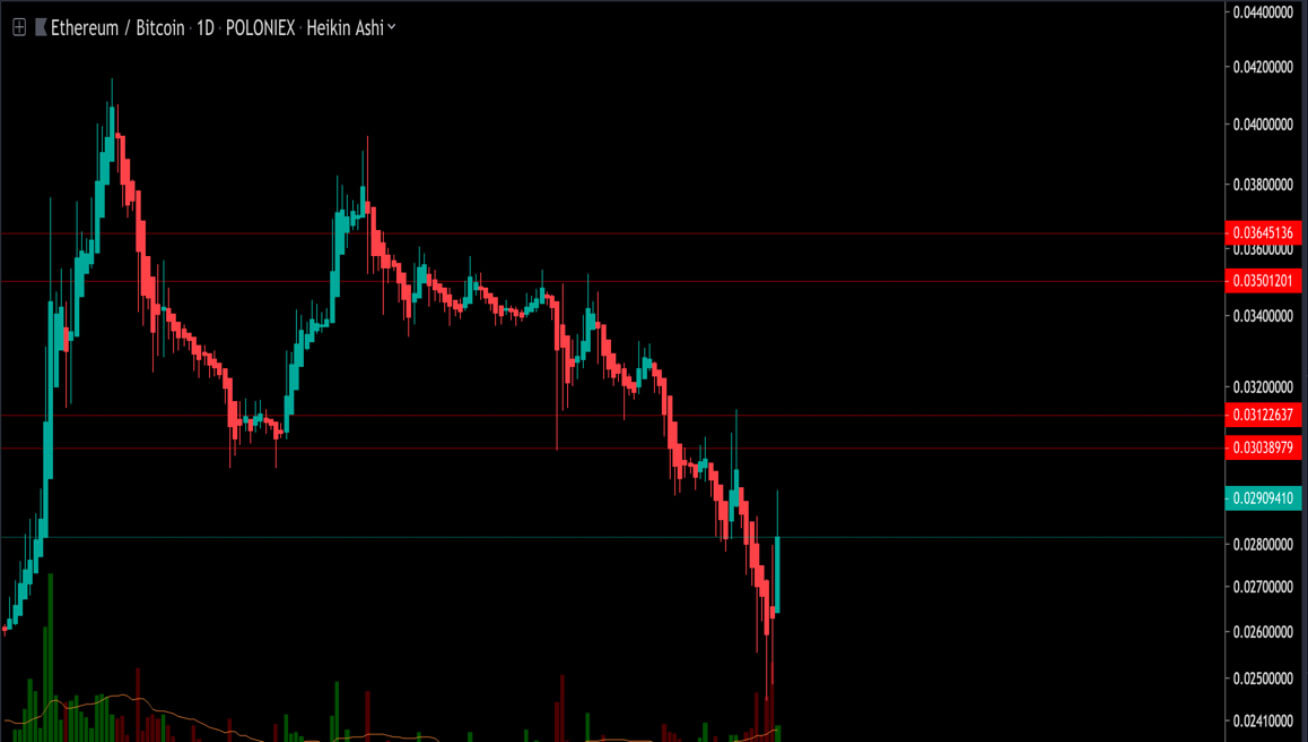
As it gains in BTC, we can expect it to gain in USD as well, as BTC/USD is going to presumably consolidate above any former resistance before its continuation. That in mind, resistance levels on Ether appear to currently residing around 0.0303, 0.0308 0.0312, and 0.035 BTC at the moment, with Ether trading at 0.029 BTC as of now. In the long run, ETH should yield strong returns yet again.
If needed, ETH/BTC’s current lows are in the 0.026 range and there is strong support and buy volume ready in case BTC dumps into oblivion.
Looking over the ETH/USD chart, it has a similar appearance to the majority of altcoins, but the dominance factor suggests the returns will be significant, perhaps more so than the top 20 altcoins.
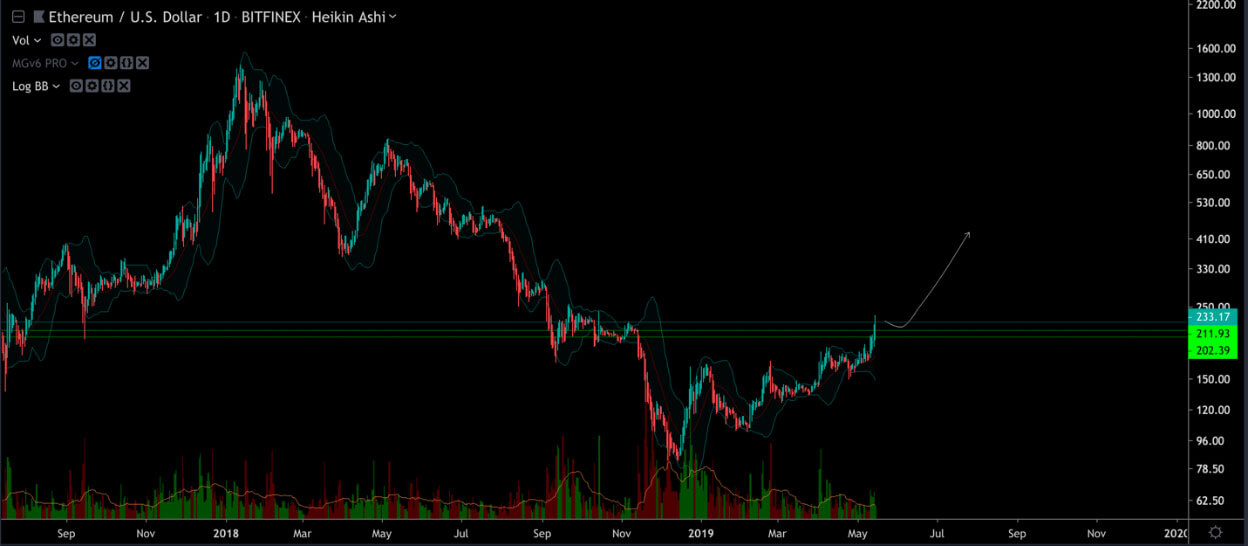
Currently, at a price right around $232, it appears to have broken out from its ascending wedge. Support can go as low as $202 before being in trouble, but the immediate short term outlook may be positive for anyone participating at the beginning of this new bull run.
Disclaimer: None of the information above should be construed as investment advice. Trading cryptocurrencies is extremely risky and we advise our readers to only trade what they can afford to lose.
Ethereum Market Data
At the time of press 7:58 pm UTC on Dec. 3, 2019, Ethereum is ranked #2 by market cap and the price is up 0.11% over the past 24 hours. Ethereum has a market capitalization of $16.15 billion with a 24-hour trading volume of $6.26 billion. Learn more about Ethereum ›
Crypto Market Summary
At the time of press 7:58 pm UTC on Dec. 3, 2019, the total crypto market is valued at at $199.83 billion with a 24-hour volume of $53.2 billion. Bitcoin dominance is currently at 66.62%. Learn more about the crypto market ›
Mentioned in this article

Latest Ethereum Stories


You might also enjoy...


Latest Press Releases


In this article
Ethereum
$3,057.94
Ethereum is a decentralized, open-source blockchain platform that enables the creation of smart contracts and decentralized applications (DApps).
Bitcoin
$63,230.64
Bitcoin, a decentralized currency that defies the sway of central banks or administrators, transacts electronically, circumventing intermediaries via a peer-to-peer network.