Misc
Visualizing Global Losses from Financial Scams
![]() See this visualization first on the Voronoi app.
See this visualization first on the Voronoi app.
Visualizing Global Losses from Financial Scams
This was originally posted on our Voronoi app. Download the app for free on iOS or Android and discover incredible data-driven charts from a variety of trusted sources.
Last year, financial scams led to almost half a trillion dollars in losses worldwide, roughly equal to the GDP of Singapore.
As fintech has advanced globally, cyber-criminals have exploited various platforms in complex attacks. Often, they will steal customers’ account information on digital payment systems and online banking sites as a highly lucrative form of attack.
This graphic shows the scale of financial losses from scams and schemes, based on data from Nasdaq’s Global Financial Crime Report for 2024.
The Most Common Types of Financial Scams
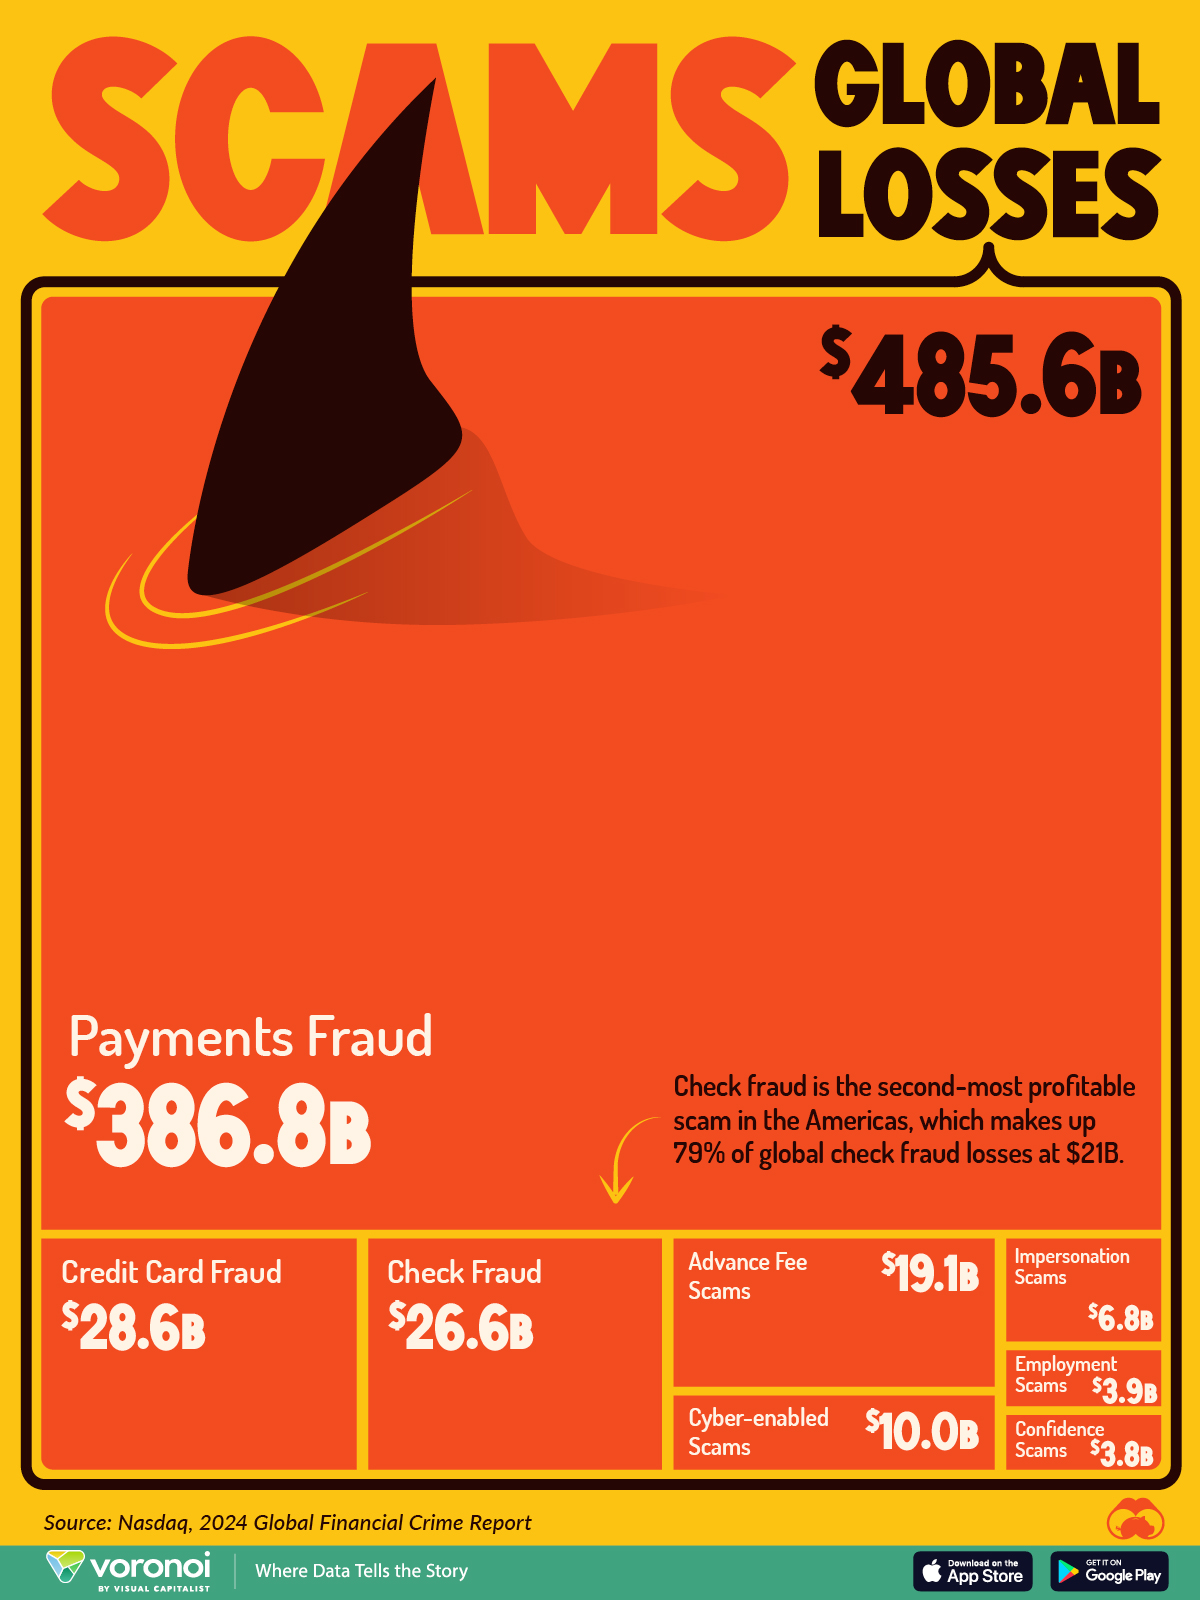
In 2023, there were $485.6 billion lost in total from financial scams, and below we break down the specific scams that generated the biggest losses:
| Type of Financial Scam/Scheme | Global Losses (USD) |
|---|---|
| Payments Fraud | $386.8B |
| Credit Card Fraud | $28.6B |
| Check Fraud | $26.6B |
| Advance Fee Scams | $19.1B |
| Cyber-enabled Scams | $10.0B |
| Impersonation Scams | $6.8B |
| Employment Scams | $3.9B |
| Confidence Scams | $3.8B |
| Total | $485.6B |
Payments Fraud the Top Financial Scam
Payments fraud makes up a staggering 80% of the total. This type of fraud occurs when payment methods are illegally manipulated to deceive or steal from a person or business.
One example of a key risk point for payments fraud are real-time payments. Here, fraudsters exploit payment systems through rerouting fund transfers. Along with this, cyber-criminals will use “banking trojans” as a primary weapon to hack account information. This type of attack lures users to click on a malicious PDF file, website, or app which steals information on a device.
Interestingly, a separate analysis showed that Brazil was the top country in the world for banking trojan scams, with 1.8 million attempted attacks over the course of June 2022 to July 2023.
Going further, business email compromise, a type of payments fraud, was the source of $6.7 billion in losses in 2023. These types of scams involve fraudsters masquerading as legitimate businesses to deceive unsuspecting customers into sending payments into fraudulent accounts.
Credit Card Fraud
Another key source of financial losses was credit card fraud.
In fact, one of the most common forms of this type of fraud is skimming, where an electronic device can be placed in an ATM which steals information in a cards magnetic strip. On average, skimming costs American consumers and financial institutions $1 billion annually.


Personal Finance
Mapped: The Income a Family Needs to Live Comfortably in Every U.S. State
Families in expensive states require over $270,000 annually to live comfortably.
The Income a Family Needs to Live Comfortably in Every U.S. State
This was originally posted on our Voronoi app. Download the app for free on iOS or Android and discover incredible data-driven charts from a variety of trusted sources.
Families in the top five most expensive U.S. states require an annual income exceeding $270,000 to live comfortably.
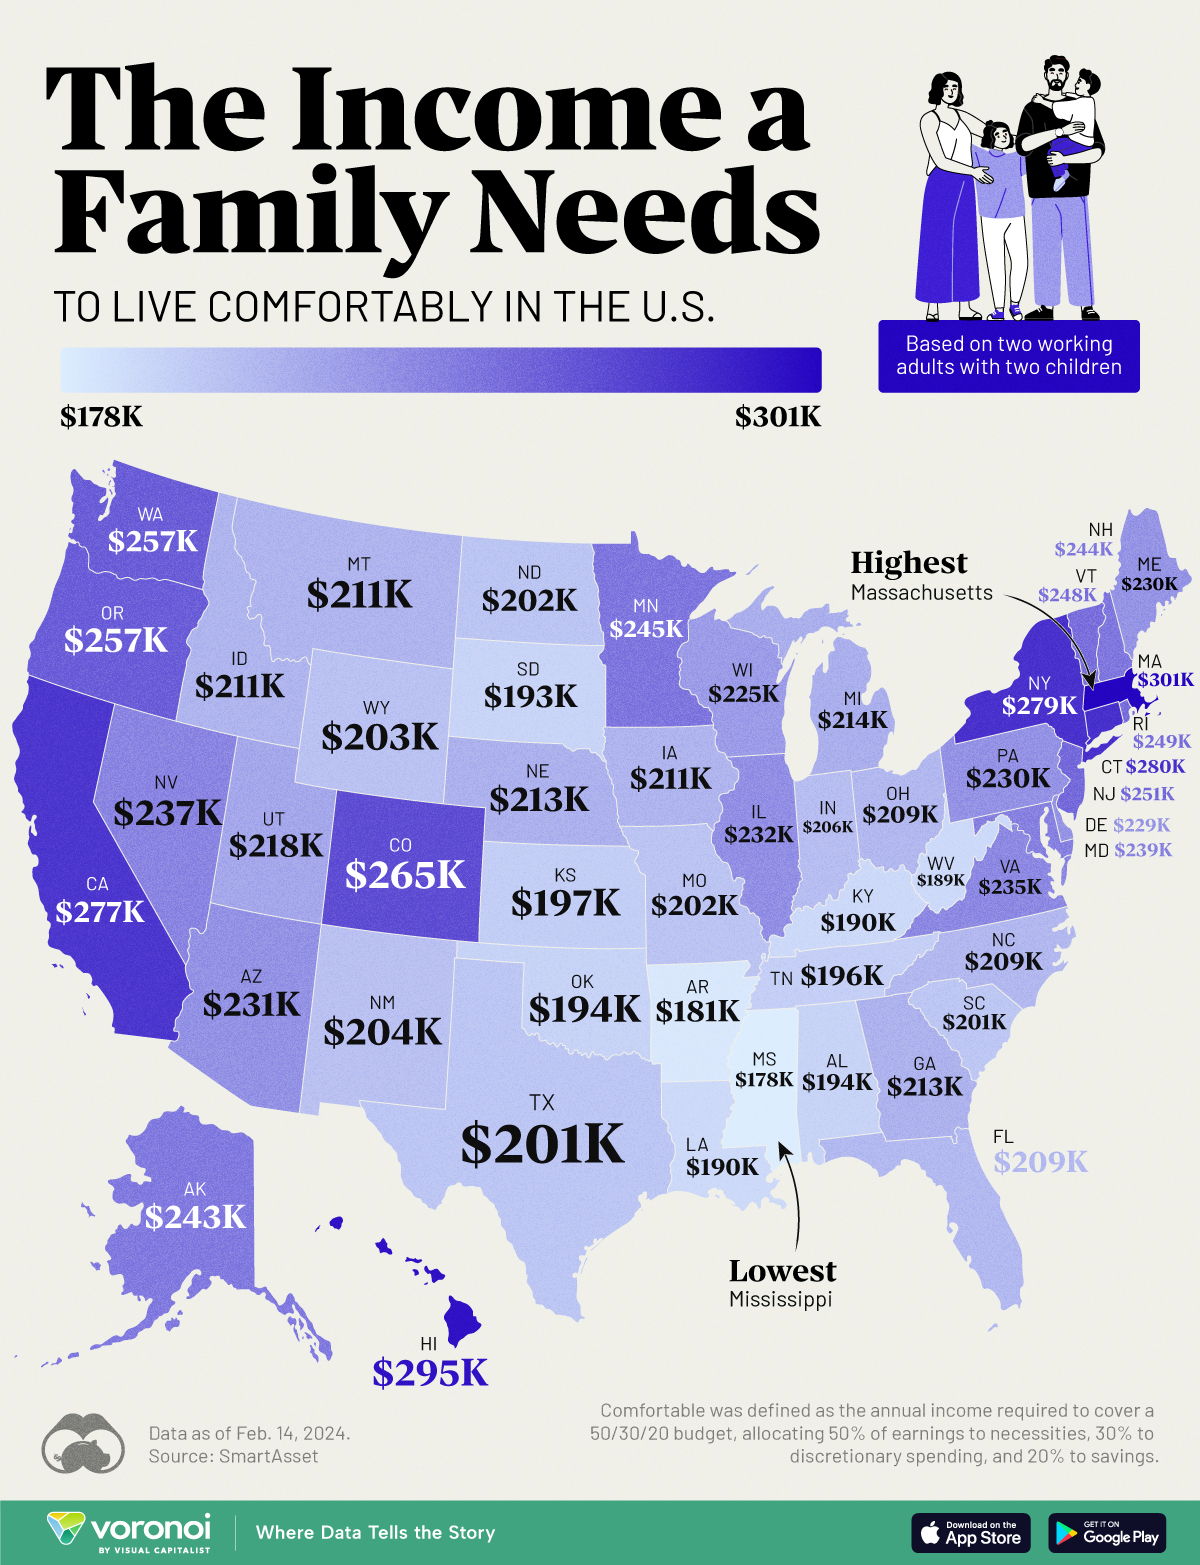
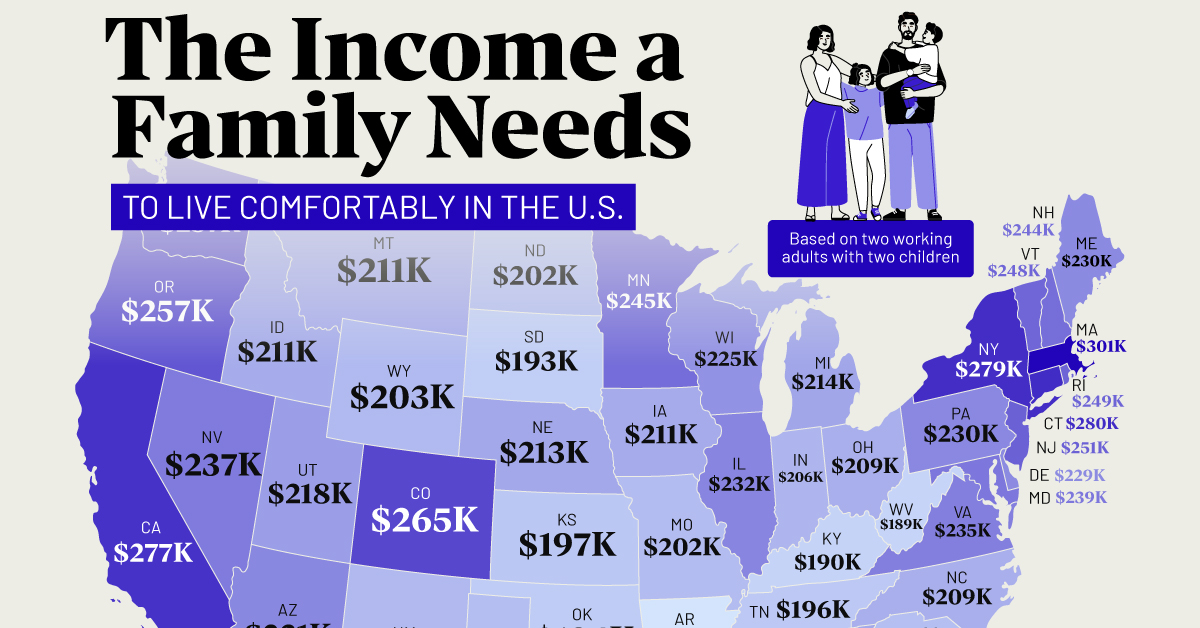
This visualization illustrates the income necessary for two working adults with two children to maintain a comfortable lifestyle in each state.
“Comfortable” is defined as the income needed to cover a 50/30/20 budget, with 50% allocated to necessities like housing and utilities, 30% to discretionary spending, and 20% to savings or investments.
The calculations for family income needed in each state were done by SmartAsset, using the cost of necessities sourced from the MIT Living Wage Calculator, last updated on Feb. 14, 2024.
Massachusetts Tops the List
Massachusetts is the most expensive state to live comfortably in, requiring a total family income of about $301,184. Hawaii ($294,611) comes in second, followed by Connecticut ($279,885).
Housing is one main reason Massachusetts is an expensive state to live in, particularly in the Boston area. In addition, the state also has a high cost of living, including expenses such as healthcare and utilities.
| Rank | State | Income for 2 working adults raising 2 children |
|---|---|---|
| 1 | Massachusetts | $301,184 |
| 2 | Hawaii | $294,611 |
| 3 | Connecticut | $279,885 |
| 4 | New York | $278,970 |
| 5 | California | $276,723 |
| 6 | Colorado | $264,992 |
| 7 | Washington | $257,421 |
| 8 | Oregon | $257,338 |
| 9 | New Jersey | $251,181 |
| 10 | Rhode Island | $249,267 |
| 11 | Vermont | $248,352 |
| 12 | Minnesota | $244,774 |
| 13 | New Hampshire | $244,109 |
| 14 | Alaska | $242,611 |
| 15 | Maryland | $239,450 |
| 16 | Nevada | $237,286 |
| 17 | Virginia | $235,206 |
| 18 | Illinois | $231,962 |
| 19 | Arizona | $230,630 |
| 20 | Pennsylvania | $230,464 |
| 21 | Maine | $229,549 |
| 22 | Delaware | $228,966 |
| 23 | Wisconsin | $225,056 |
| 24 | Utah | $218,483 |
| 25 | Michigan | $214,490 |
| 26 | Nebraska | $213,075 |
| 27 | Georgia | $212,826 |
| 28 | Montana | $211,411 |
| 28 | Iowa | $211,411 |
| 30 | Idaho | $211,245 |
| 31 | North Carolina | $209,331 |
| 31 | Ohio | $209,331 |
| 33 | Florida | $209,082 |
| 34 | Indiana | $206,003 |
| 35 | New Mexico | $203,923 |
| 36 | Wyoming | $203,424 |
| 37 | Missouri | $202,259 |
| 38 | North Dakota | $202,176 |
| 39 | Texas | $201,344 |
| 40 | South Carolina | $200,762 |
| 41 | Kansas | $196,768 |
| 42 | Tennessee | $195,770 |
| 43 | Oklahoma | $194,106 |
| 44 | Alabama | $193,606 |
| 45 | South Dakota | $192,608 |
| 46 | Kentucky | $190,112 |
| 47 | Louisiana | $189,613 |
| 48 | West Virginia | $189,363 |
| 49 | Arkansas | $180,794 |
| 50 | Mississippi | $177,798 |
Meanwhile, Mississippi is the least expensive state for a family to live comfortably, requiring $177,798 per year. Arkansas ($180,794) comes in second, followed by West Virginia ($189,363). In common, all these states share low prices of housing.
Learn More About Cost of Living From Visual Capitalist
If you enjoyed this post, be sure to check out this graphic, which ranks the median down payment for a house by U.S. state.

-

 Debt1 week ago
Top 10 Countries Most in Debt to the IMF
-

 Economy2 weeks ago
Visualizing the Tax Burden of Every U.S. State
-

 Automotive2 weeks ago
How People Get Around in America, Europe, and Asia
-

 Economy2 weeks ago
Mapped: Southeast Asia’s GDP Per Capita, by Country
-

 Demographics2 weeks ago
Mapped: U.S. Immigrants by Region
-

 Healthcare2 weeks ago
Which Countries Have the Highest Infant Mortality Rates?
-

 Misc2 weeks ago
Charted: How Americans Feel About Federal Government Agencies
-

 Mining2 weeks ago
Visualizing Copper Production by Country in 2023