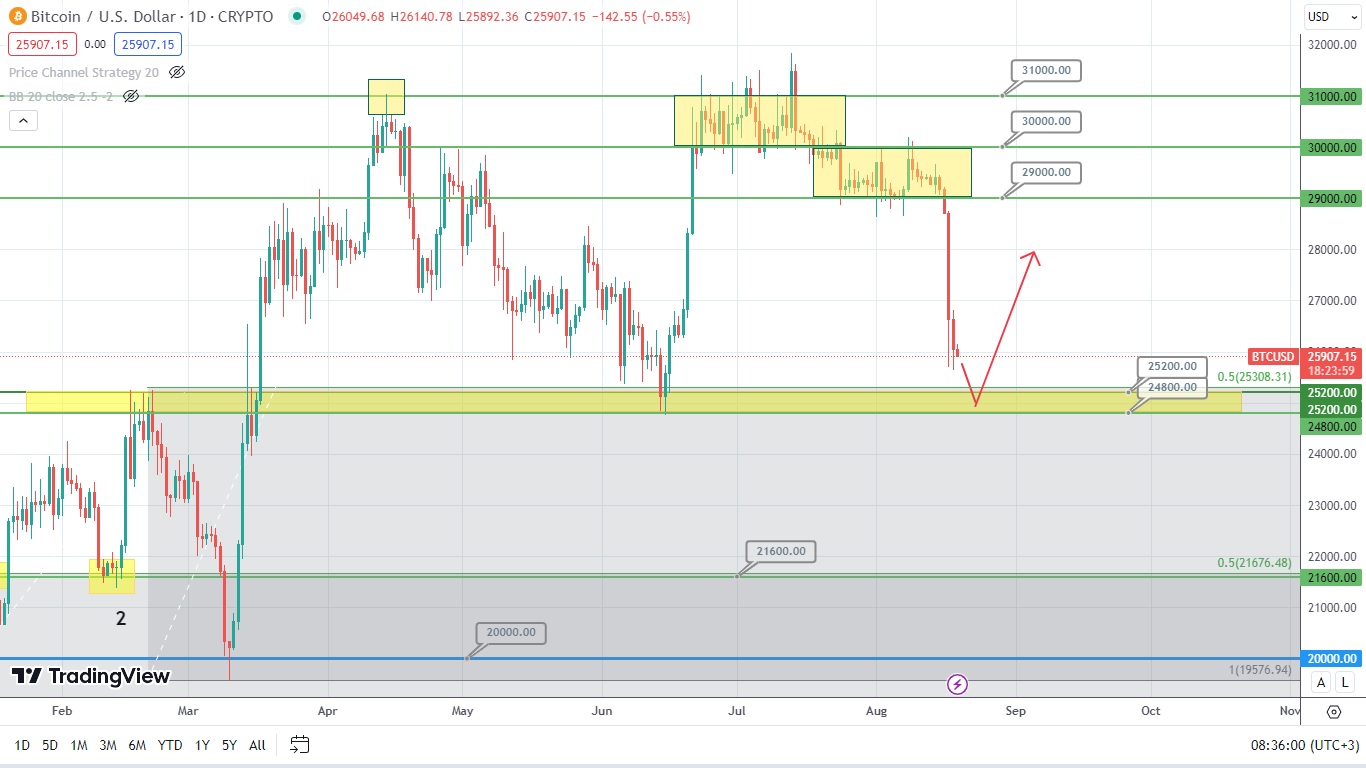
Bitcoin has dropped. The asset’s price is now approaching a very important supporting zone formed between levels 24800 and 25200. This zone might drive Bitcoin up. So far, the Bitcoin move can be considered a mere correction. In this case, it would be wise to check the price movements, that is, the candlestick formations next to the supporting zone. Bitcoin might also manage to break even the strongest levels. Should Bitcoin break any level on its way toward the supporting zone, the asset could gain the required support at the level of 21600. But so far it looks like Bitcoin might potentially rebound from the support and jump. Time will tell what is going to happen next.

The price of gold is approaching the supporting level of 1900. The asset might potentially rebound from this level and jump. So, it’s important to follow the price movements at this level.

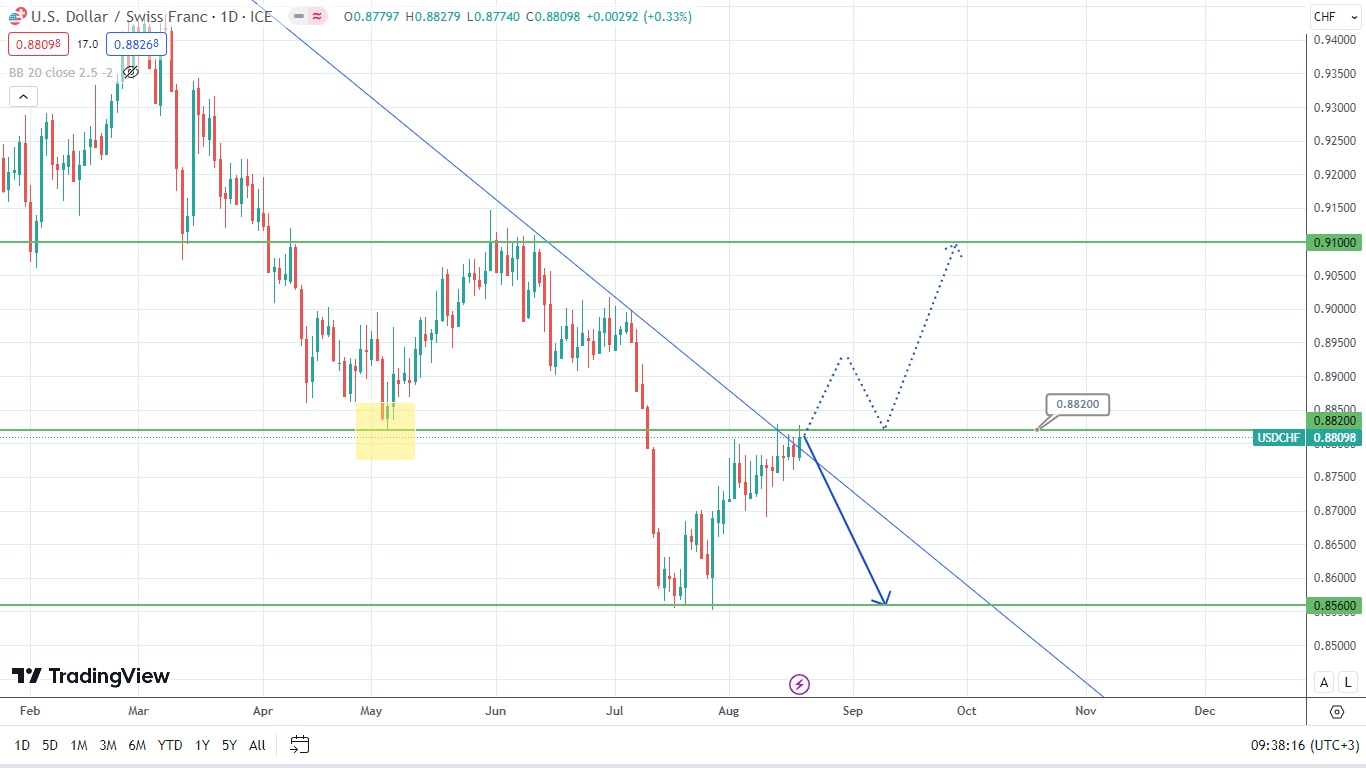
Currently, the Swiss franc is testing the resistance level of 0.8820 next to the daily downtrend. Asset’s price is likely to rebound at the crossing point of these trendlines although the asset is likely to break the resistance and jump. It would be important to check the price movements below this level.
Disclaimer: The material provided is for information purposes only and should not be considered as investment advice. The views, information, or opinions expressed in the text belong solely to the author, and not to the author’s employer, organization, committee or other group or individual or company.
Past performance is not indicative of future results.
High Risk Warning: CFDs are complex instruments and come with a high risk of losing money rapidly due to leverage. 71% and 70% of retail investor accounts lose money when trading CFDs with Tickmill UK Ltd and Tickmill Europe Ltd respectively. You should consider whether you understand how CFDs work and whether you can afford to take the high risk of losing your money.