
Advertisement
Advertisement
ETH Target Remains Sub-$1,750 on Bearish Withdrawals Profile
By:
It is a busy day for ETH, with US economic indicators and debt ceiling talks to influence Fed sentiment. However, staking stats will also move the dial.

In this article:
Key Insights:
- On Thursday, ETH gained 0.33% to end the day at $1,806.
- Reports of progress toward a US debt ceiling deal provided support while staking statistics were bearish.
- However, the technical indicators remained bearish, signaling a return to sub-$1,750.
Ethereum (ETH) rose by 0.33% on Thursday. Partially reversing a 2.91% loss from Wednesday, ETH ended the day at $1,806. Despite the bullish session, ETH fell short of the $1,850 handle for the first time in three sessions.
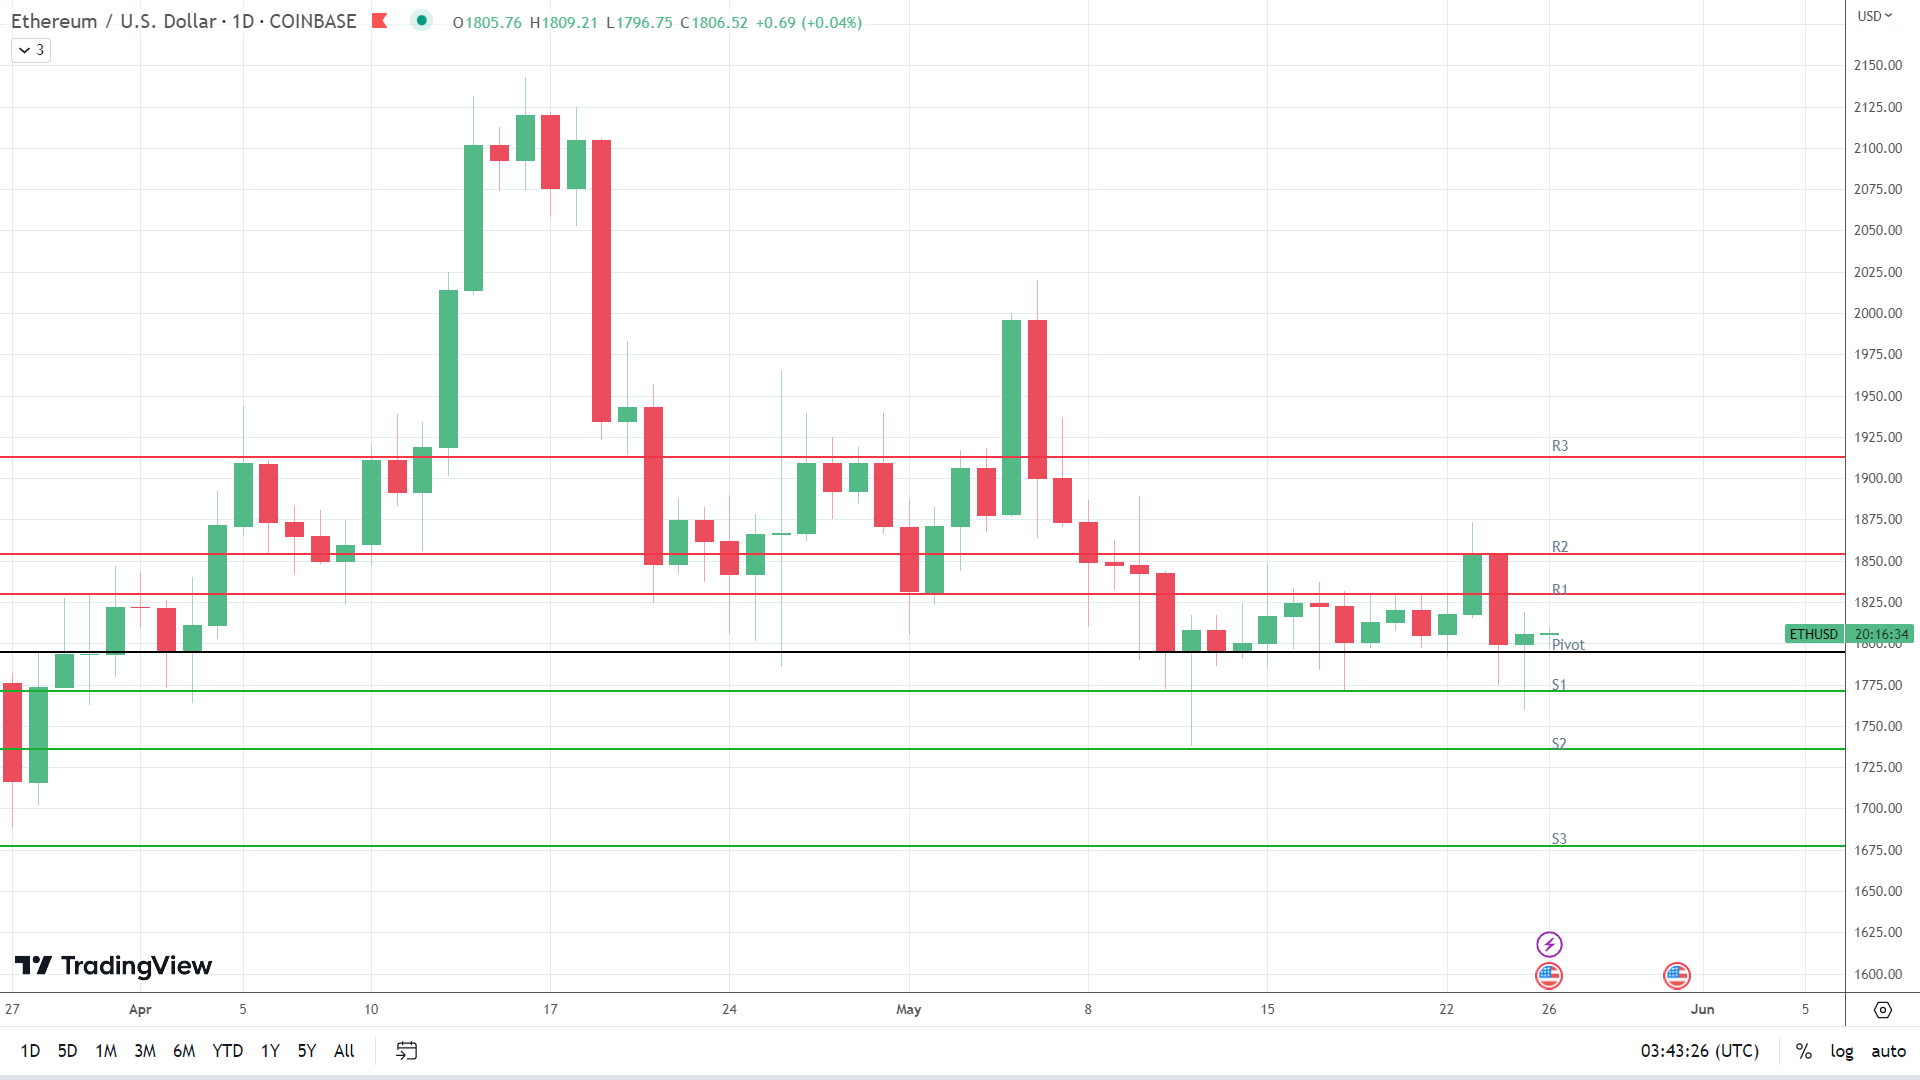
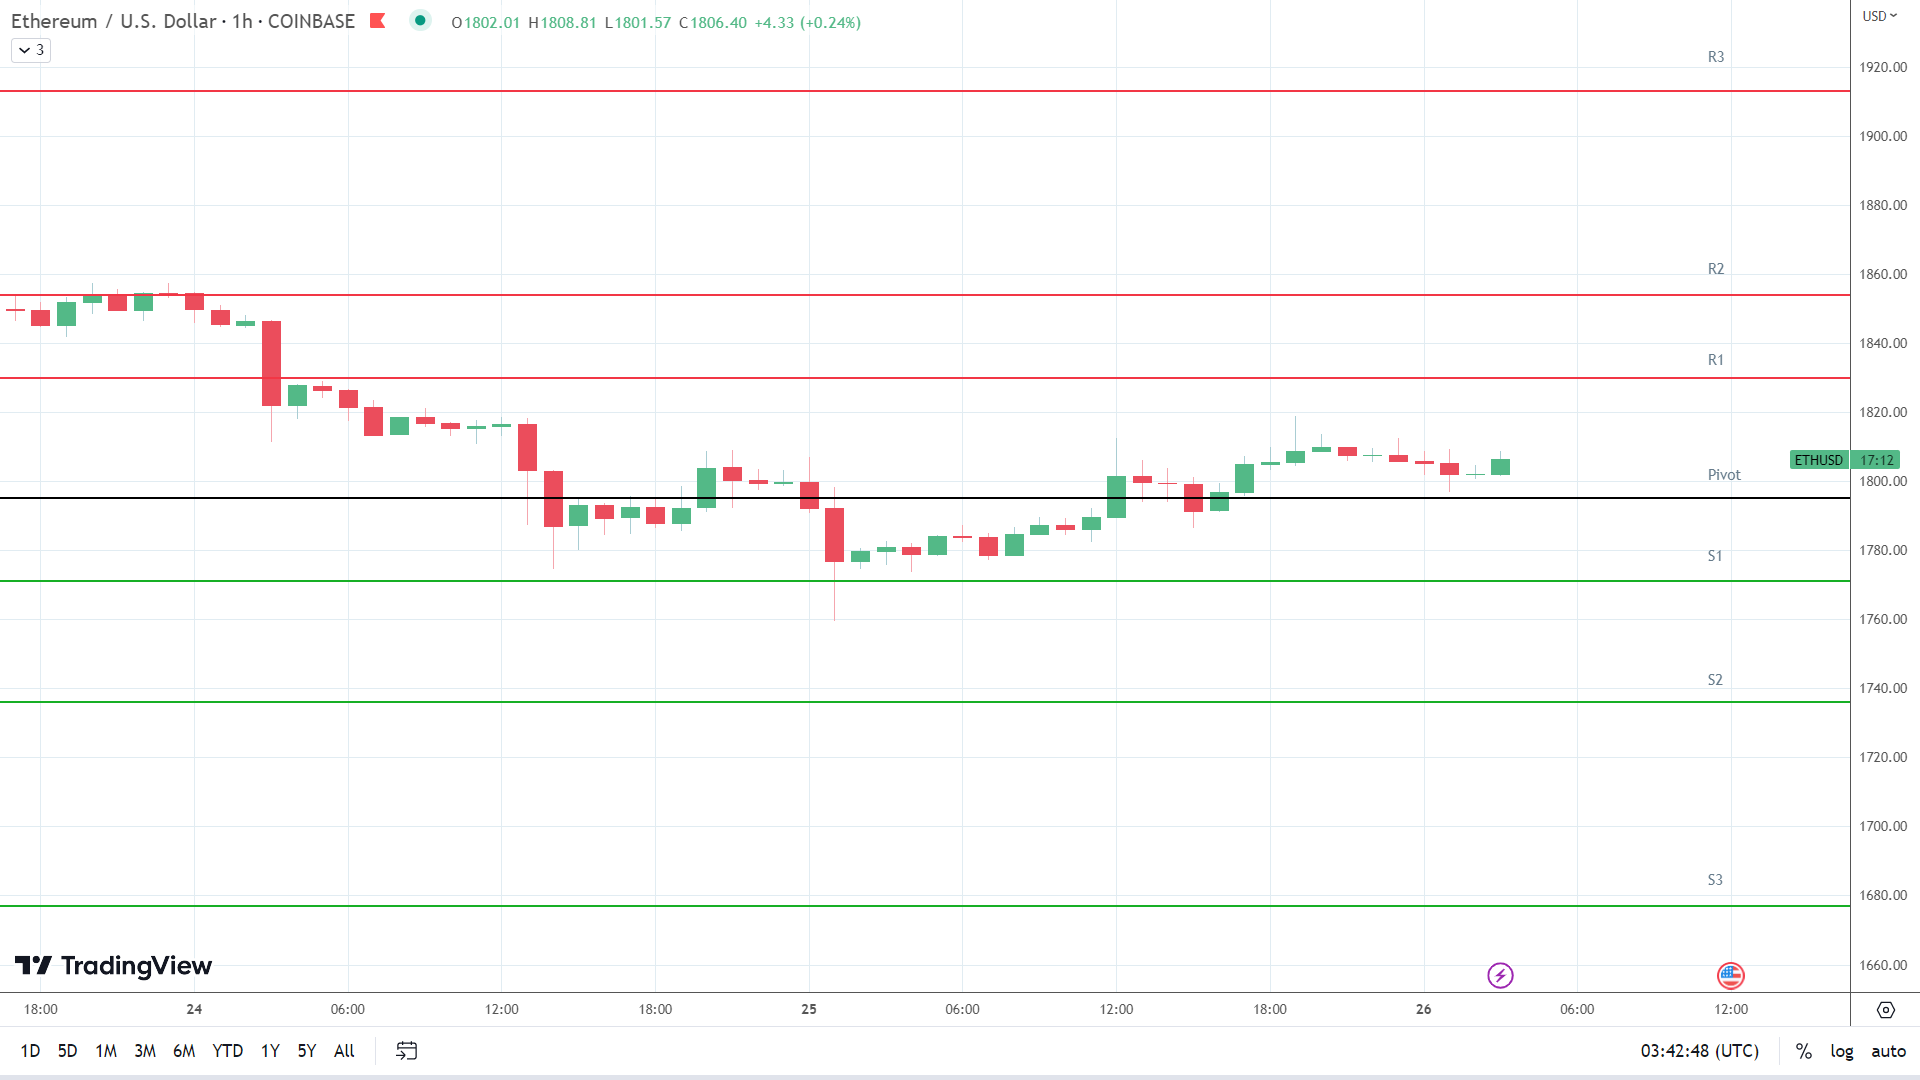
Tracking the broader crypto market, ETH fell to an early morning low of $1,760 before making a move. Finding support at the First Major Support Level (S1) at $1,765, ETH rose to an early evening high of $1,819. However, falling short of the First Major Resistance Level (R1) at $1,845, ETH eased back to end the day at $1,806.
Staking Inflows and Fed Fear Weighed
According to CryptoQuant, staking inflows fell 76,256 ETH on Wednesday to 58,624 ETH on Thursday. The second consecutive decline sent bearish signals.
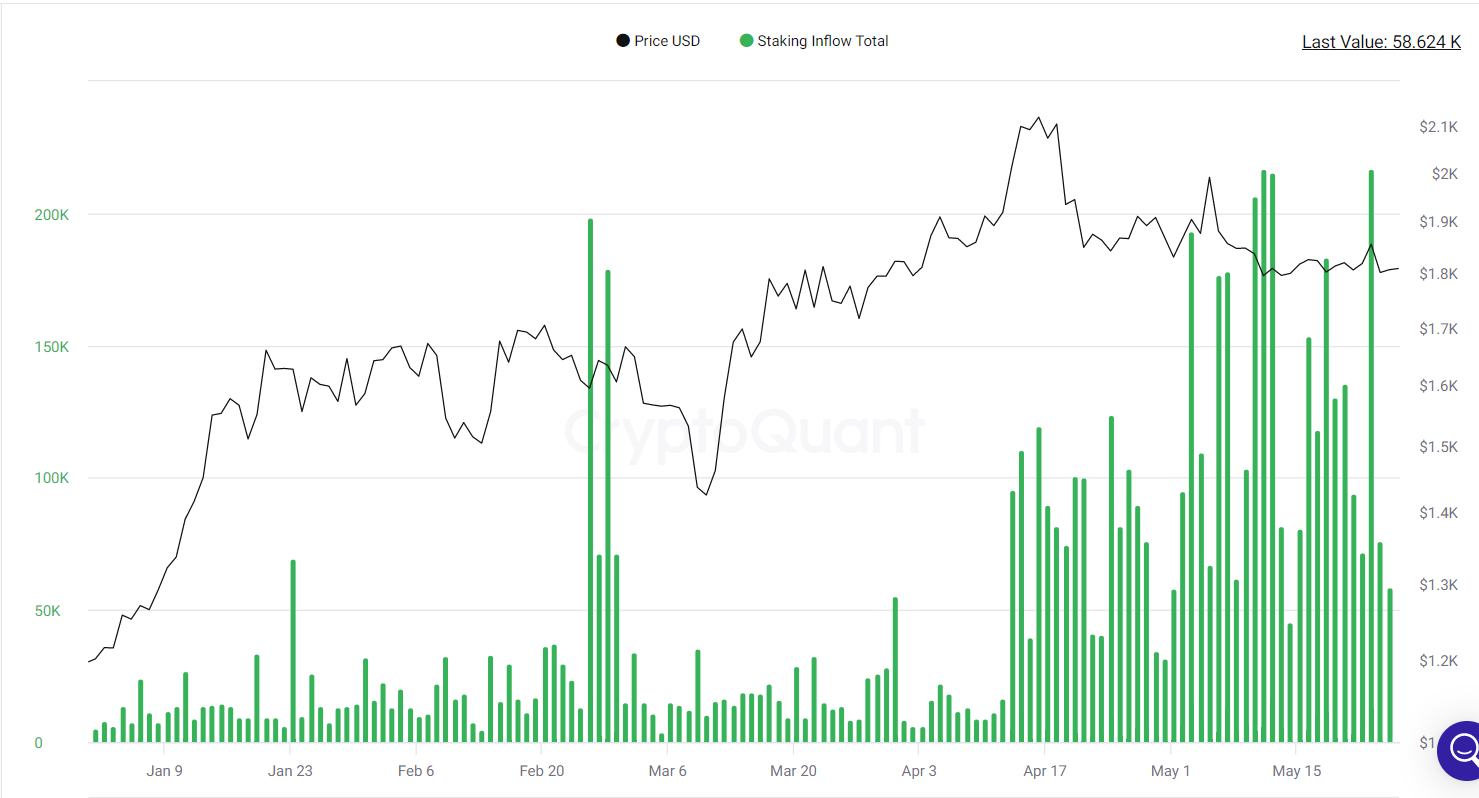
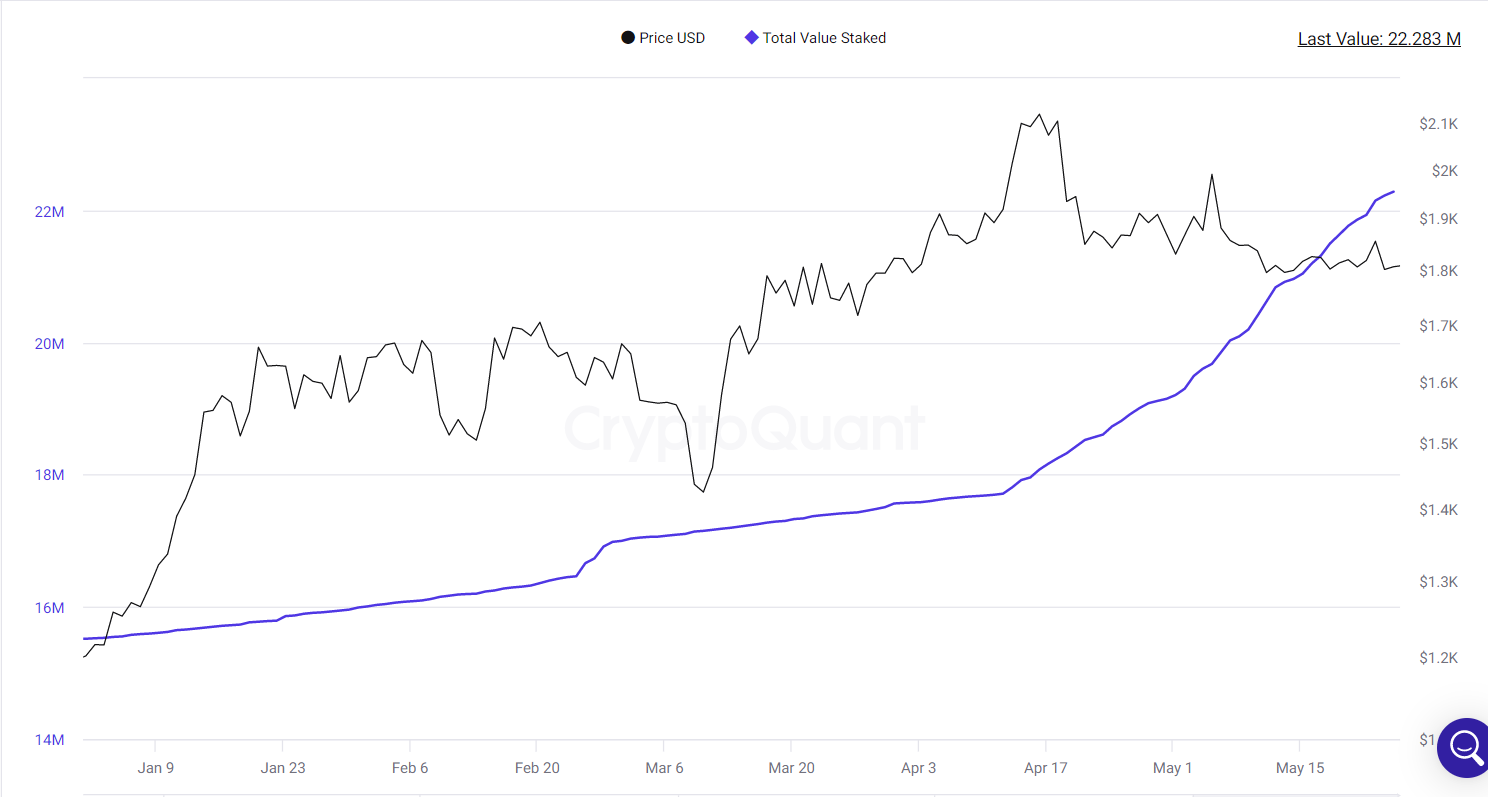
The total value staked climbed higher, supported by the bullish Thursday session.
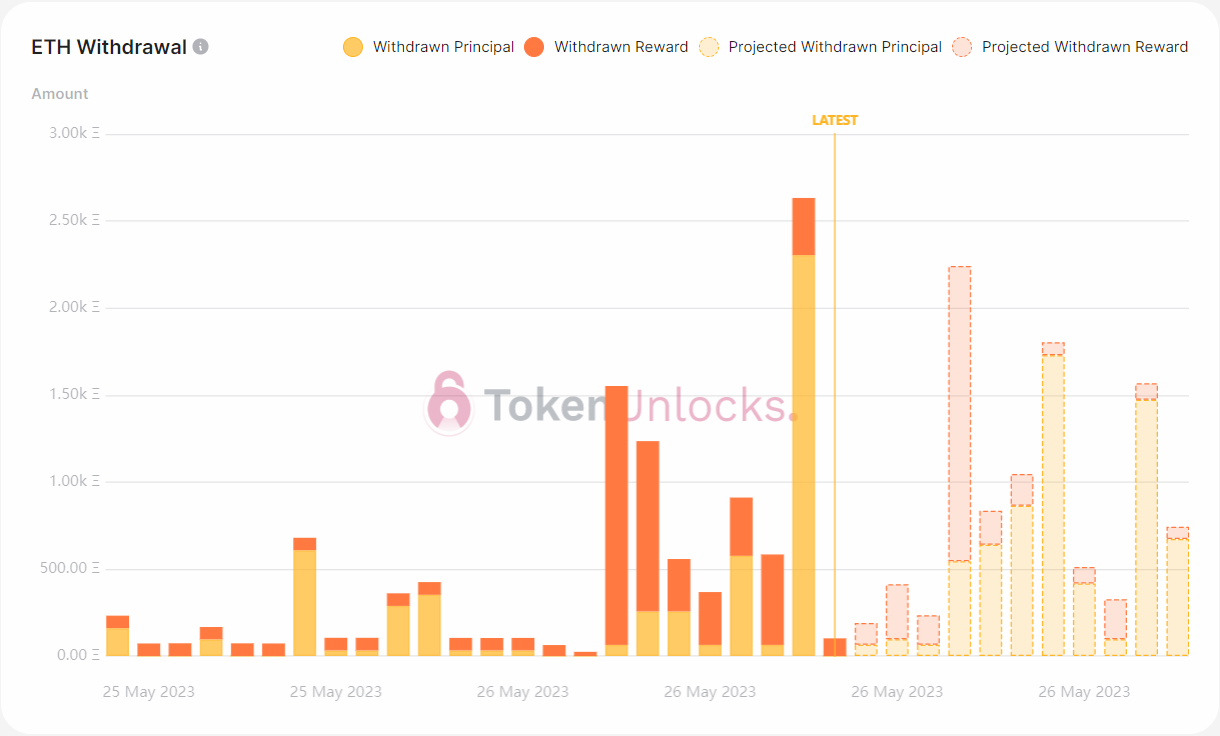
However, the withdrawal profile was bearish. Overnight, principal withdrawals increased to above-normal levels. Withdrawal projections for the morning session were also bearish, with principal ETH withdrawals expected to remain elevated.
On Thursday, the net ETH staking balance fell from a surplus of 220,950 ETH on Wednesday to an 80,270 ETH surplus, equivalent to $148.22 million. Deposits totaled 86,730 ETH versus withdrawals of 6,460 ETH.
According to TokenUnlocks, total pending withdrawals stood at 43,600 ETH, equivalent to approximately $78.70 million. Notably, the staking APR stood at 8.59%, up 1.78% over 24 hours.
Beyond the crypto market, rising bets of a 25-basis point Fed interest rate hike in June tested buyer appetite. Upbeat US labor market and Q1 GDP numbers fueled bets on a June interest rate hike.
However, reports of progress toward a deal to raise the US debt ceiling cushioned the downside.
The Day Ahead
It is a busier day for ETH. US Core durable goods orders, Core PCE Price Index, personal spending/income, and Michigan consumer sentiment numbers will be in focus.
We expect the Core PCE Price Index numbers to have the most impact. Sticky inflation would fuel bets of a 25-basis point Fed interest rate hike in June and ease expectations of an H2 interest rate cut.
Economists forecast the Core PCE Price Index to increase by 4.6% year-over-year in April versus 4.6% in March.
While the US economic indicators will influence, investors should track US debt ceiling-related news. Further progress toward a deal would provide price support.
However, investors should also monitor the staking statistics and the withdrawal profile. A further decline in ETH staking inflows and a spike in withdrawals would test buyer appetite.
SEC v Ripple updates and Binance and Coinbase (COIN)-related news would also move the dial.
Ethereum Price Action
This morning, ETH was up 0.04% to $1,807. A range-bound start to the day saw ETH rise to an early high of $1,809 before falling to a low of $1,797.
ETH Technical Indicators
Resistance & Support Levels
| R1 – $ | 1,830 | S1 – $ | 1,771 |
| R2 – $ | 1,854 | S2 – $ | 1,736 |
| R3 – $ | 1,913 | S3 – $ | 1,677 |
ETH needs to avoid the $1,795 pivot to target the First Major Resistance Level (R1) at $1,830. A move through the Thursday high of $1,819 would signal a breakout session. However, ETH staking statistics, US economic indicators, and US debt ceiling updates must support a bullish session.
In the event of an extended rally, the bulls would likely test the Second Major Resistance Level (R2) at $1,854. The Third Major Resistance Level (R3) sits at $1,913.
A fall through the pivot would bring the First Major Support Level (S1) at $1,771 into play. However, barring a risk-off-fueled sell-off, ETH should avoid sub-$1,750 and the Second Major Support Level (S2) at $1,736. The Third Major Support Level (S3) sits at $1,677.
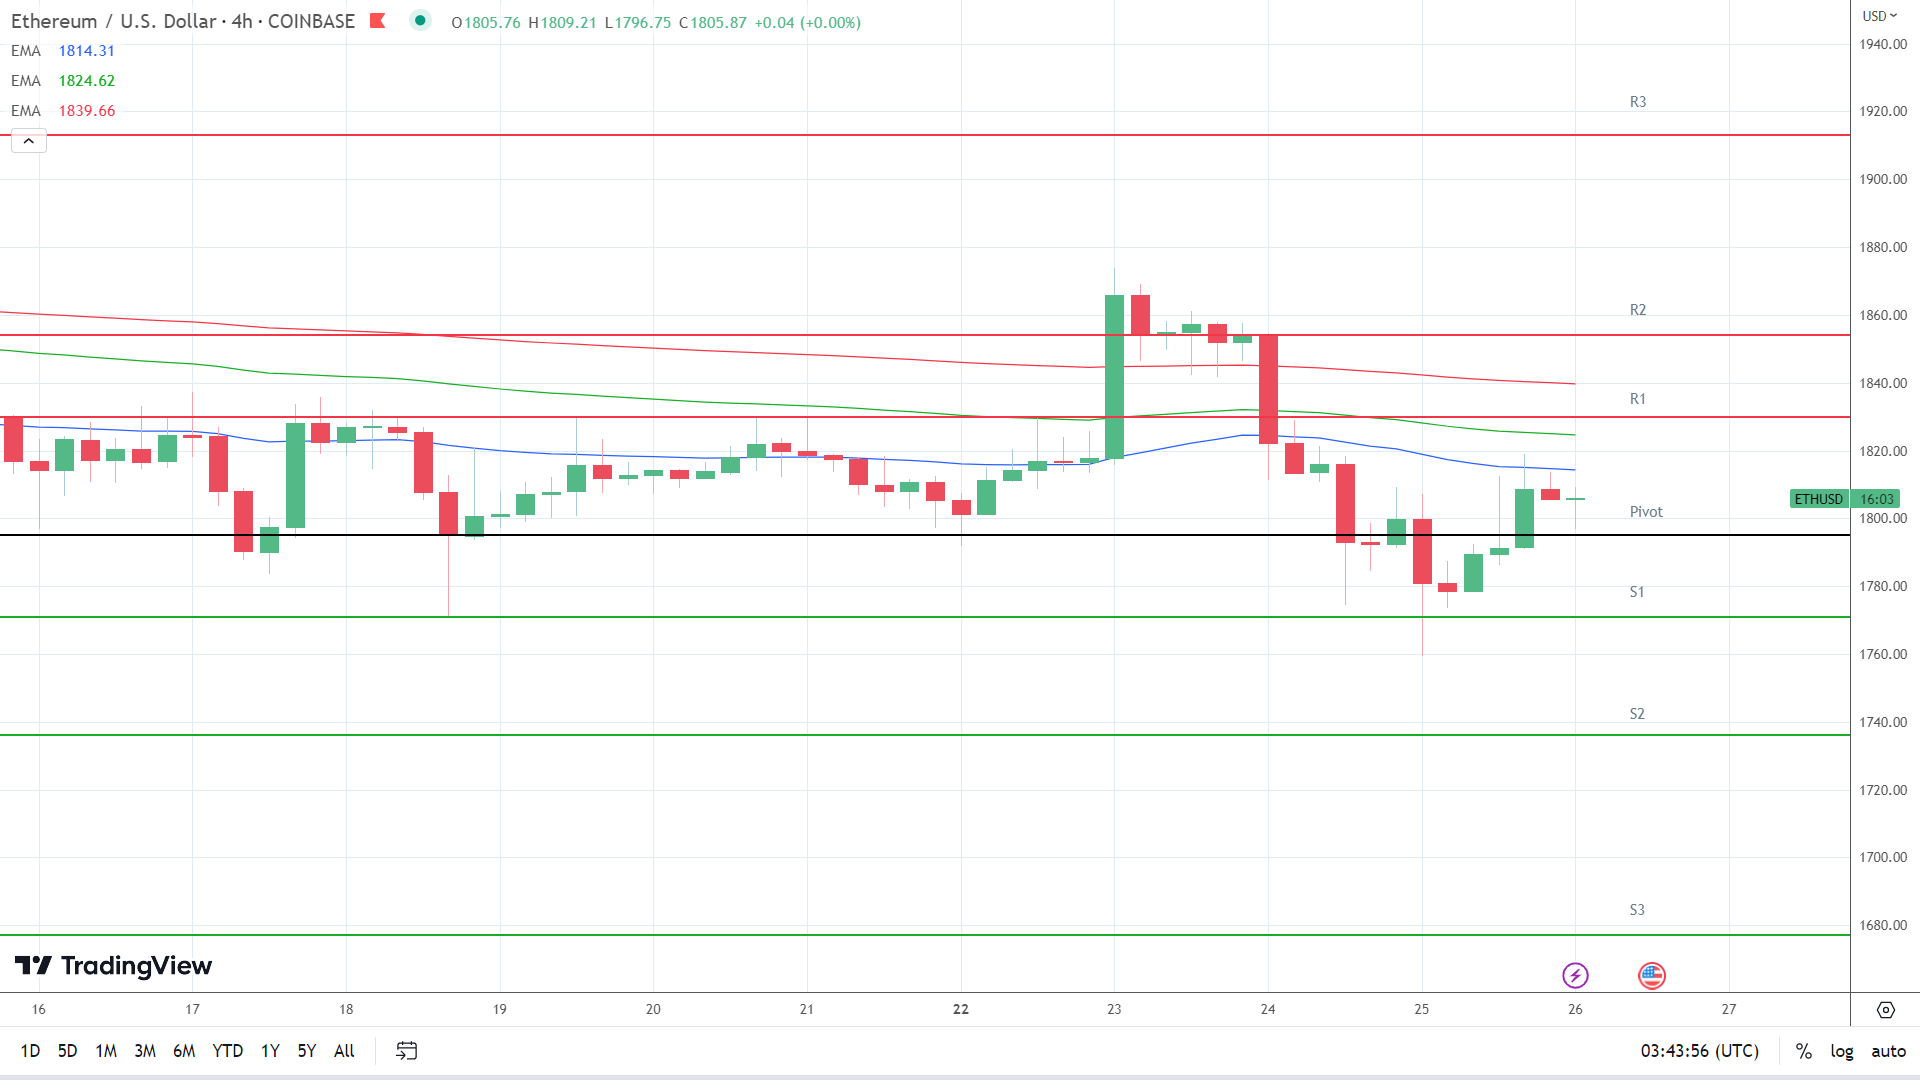
Looking at the EMAs and the 4-hourly candlestick chart (below), it was a bearish signal. Ethereum sat below the 50-day EMA, currently at $1,814. The 50-day EMA eased back from the 100-day EMA, with the 100-day EMA falling back from the 200-day EMA, delivering bearish signals.
A move through the 50-day ($1,814) and 100-day ($1,825) EMAs would support a breakout from R1 ($1,830) and the 200-day EMA ($1,840) to target R2 ($1,854). However, failure to move through the 50-day EMA ($1,814) would leave S1 ($1,771) and sub-$1,750 Major Support Levels in view.
A move through the 50-day EMA would send a bullish signal.
About the Author
Bob Masonauthor
With over 20 years of experience in the finance industry, Bob has been managing regional teams across Europe and Asia and focusing on analytics across both corporate and financial institutions. Currently he is covering developments relating to the financial markets, including currencies, commodities, alternative asset classes, and global equities.
Did you find this article useful?
Latest news and analysis


Advertisement