
Advertisement
Advertisement
ETH Eyes Sub-$1,750 on Falling Staking Inflows and the Debt Crisis
By:
ETH was back in the red this morning. A slump in staking inflows on Wednesday and debt ceiling-related news will test buyer appetite today.

In this article:
Key Insights:
- On Wednesday, ETH fell by 2.91% to end the day at $1,800.
- ETH staking inflows and the US debt ceiling crisis weighed on investor sentiment.
- The technical indicators turned more bearish, signaling a return to sub-$1,750.
Ethereum (ETH) fell by 2.91% on Wednesday. Reversing a 1.98% gain from Tuesday, ETH ended the day at $1,800. Despite the bearish session, ETH wrapped up the session at $1,800 for the eleventh consecutive session.
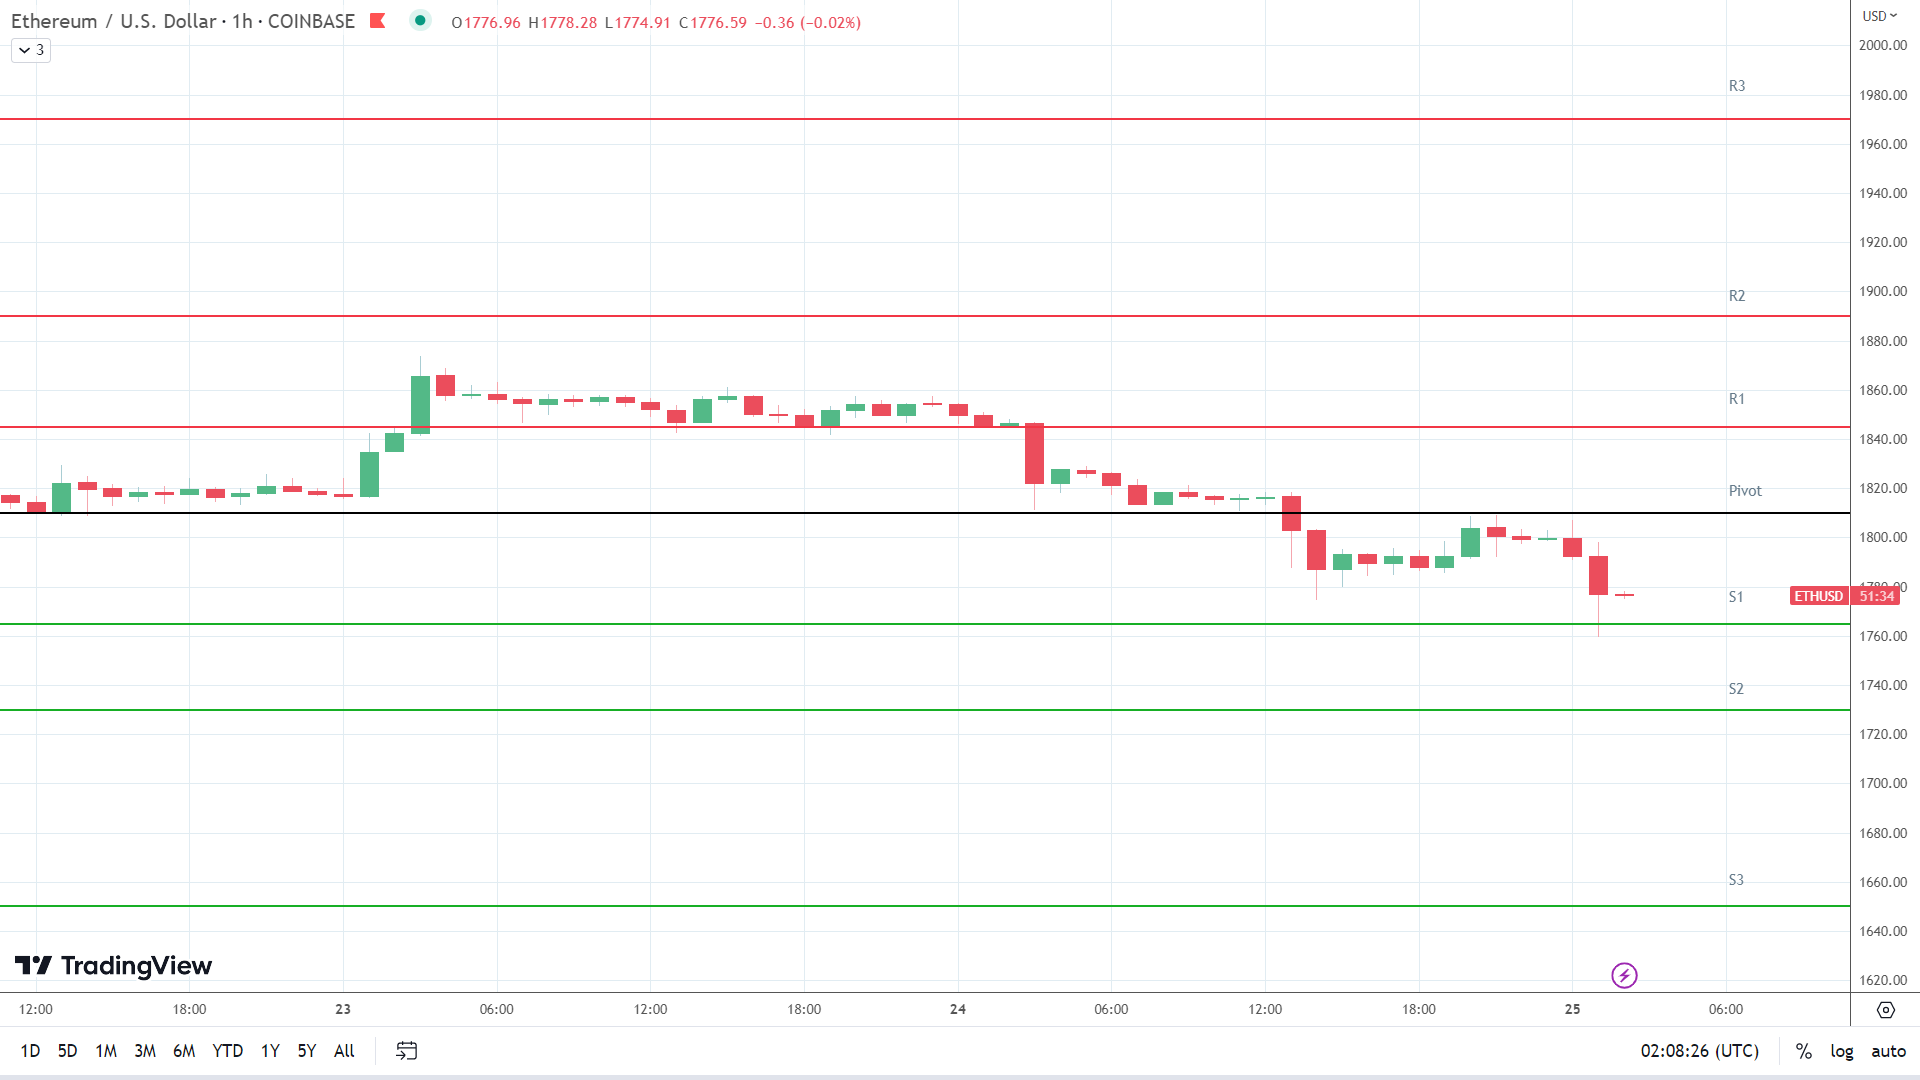
Tracking the broader crypto market, ETH fell from a first-hour high of $1,855 to an early afternoon low of $1,775. ETH fell through the First Major Support Level (S1) at $1,822 and briefly through the Second Major Support Level (S2) at $1,790 before ending the day at $1,800.
Staking Inflows and US Debt Ceiling News Weigh
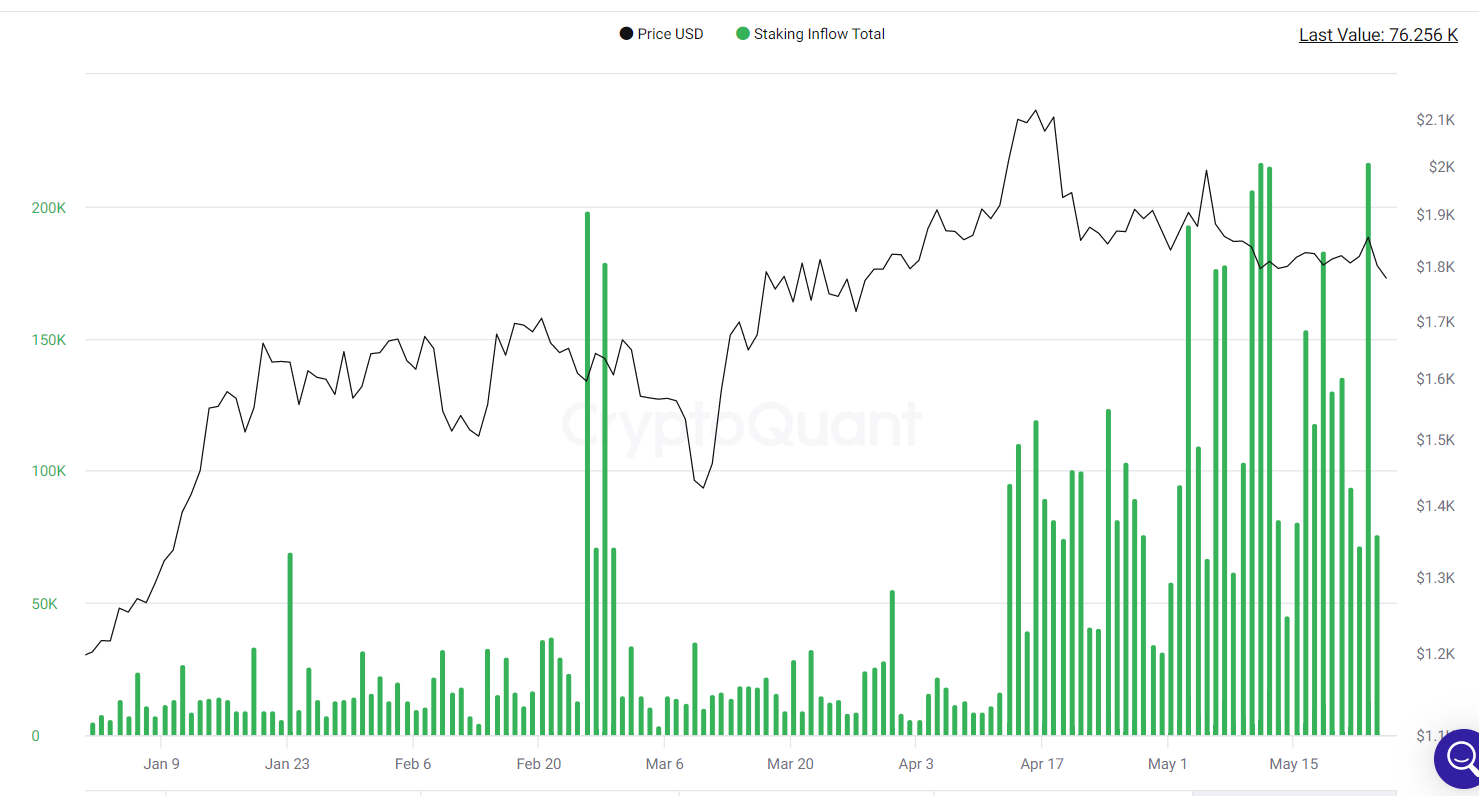
According to CryptoQuant, staking inflows tumbled from 217,056 ETH on Tuesday to 76,256 on Wednesday. The fall to below 100,000 was bearish, supporting the ETH pullback to sub-$1,800.
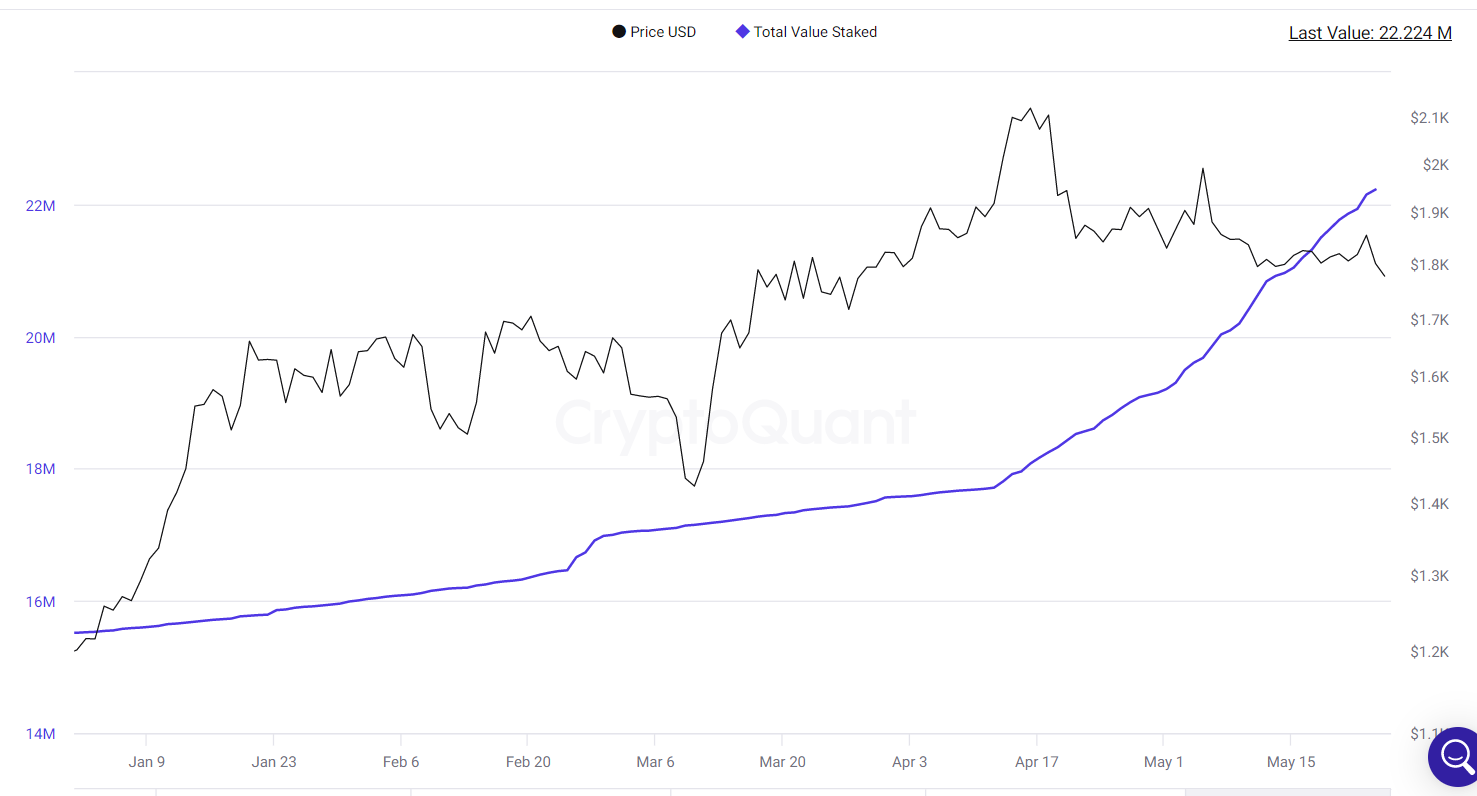
The total value staked climbed higher, albeit at a slower pace, supported by the staking inflows.
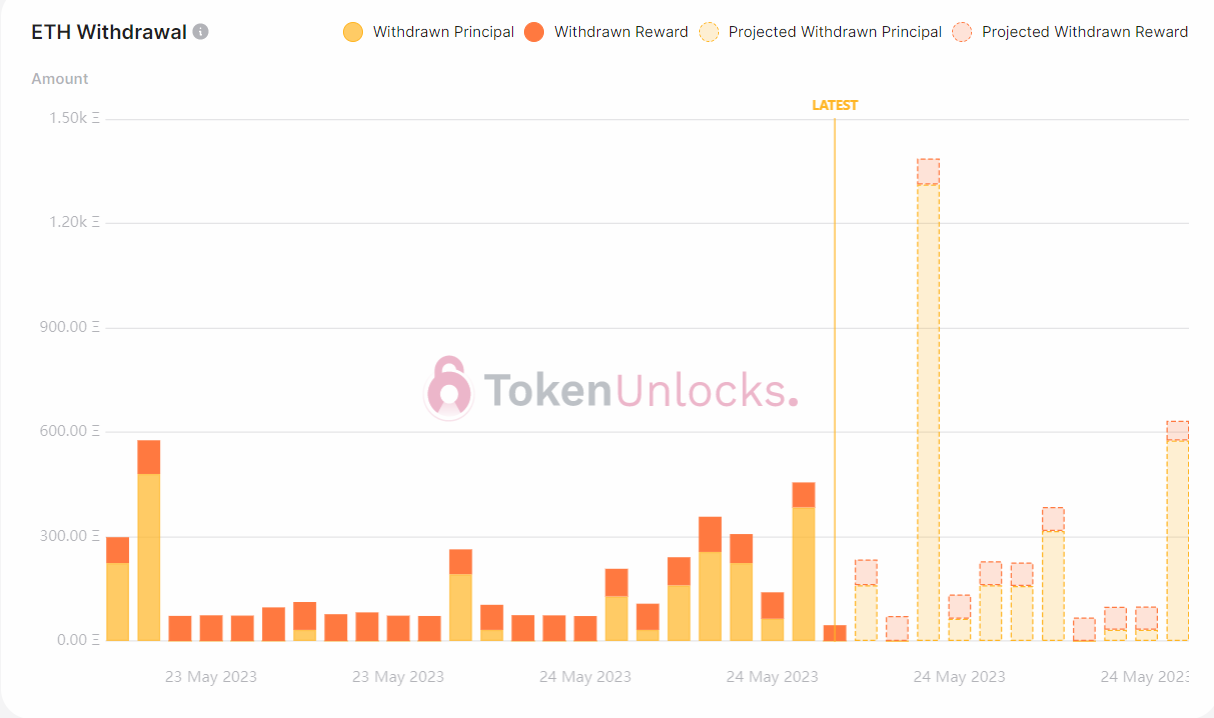
The withdrawal profile was bearish. Overnight, principal withdrawals increased to above-normal levels. However, withdrawal projections for the morning session were more bullish, with principal ETH withdrawals expected to return to normal ETH withdrawal levels.
On Wednesday, the net ETH staking balance jumped from a surplus of 56,510 ETH on Tuesday to a 220,950 ETH surplus, equivalent to $408.36 million. Deposits totaled 225,330 ETH versus withdrawals of 4,370 ETH.
According to TokenUnlocks, total pending withdrawals stood at 46,420 ETH, equivalent to approximately $85.70 million. Notably, the staking APR stood at 8.66%, unchanged over 24 hours.
Beyond the crypto market, the US debt ceiling crisis and the FOMC meeting minutes weighed on investor sentiment. However, the lack of progress toward raising the US debt ceiling remained the key driver.
On Wednesday, the FOMC meeting minutes gave no surprises to distract investors from the debt ceiling crisis. However, FOMC members did not write off a June interest rate hike. Concerns over inflation raised bets on a June move. However, FOMC members voiced worries about the debt ceiling.
According to the CME FedWatch Tool, the probability of a 25-basis point Fed interest rate hike in June stood at 36.4%, up from 28.1% on Tuesday.
The Day Ahead
It is a busier day for ETH, with US GDP and jobless claims in focus. An upward revision to the GDP numbers and a fall in initial jobless claims would support more hawkish Fed bets. However, the influence of the numbers hinges on US debt ceiling talks.
Investors should also continue to monitor the staking statistics and the withdrawal profile. A further decline in staking inflows would test buyer appetite.
SEC v Ripple updates and Binance and Coinbase (COIN)-related news would also move the dial.
Ethereum Price Action
This morning, ETH was down 1.30% to $1,760. A mixed start to the day saw ETH rise to an early high of $1,807 before falling to a low of $1,760. ETH tested the First Major Support Level (S1) at $1,765.
ETH Technical Indicators
Resistance & Support Levels
| R1 – $ | 1,845 | S1 – $ | 1,765 |
| R2 – $ | 1,890 | S2 – $ | 1,730 |
| R3 – $ | 1,970 | S3 – $ | 1,650 |
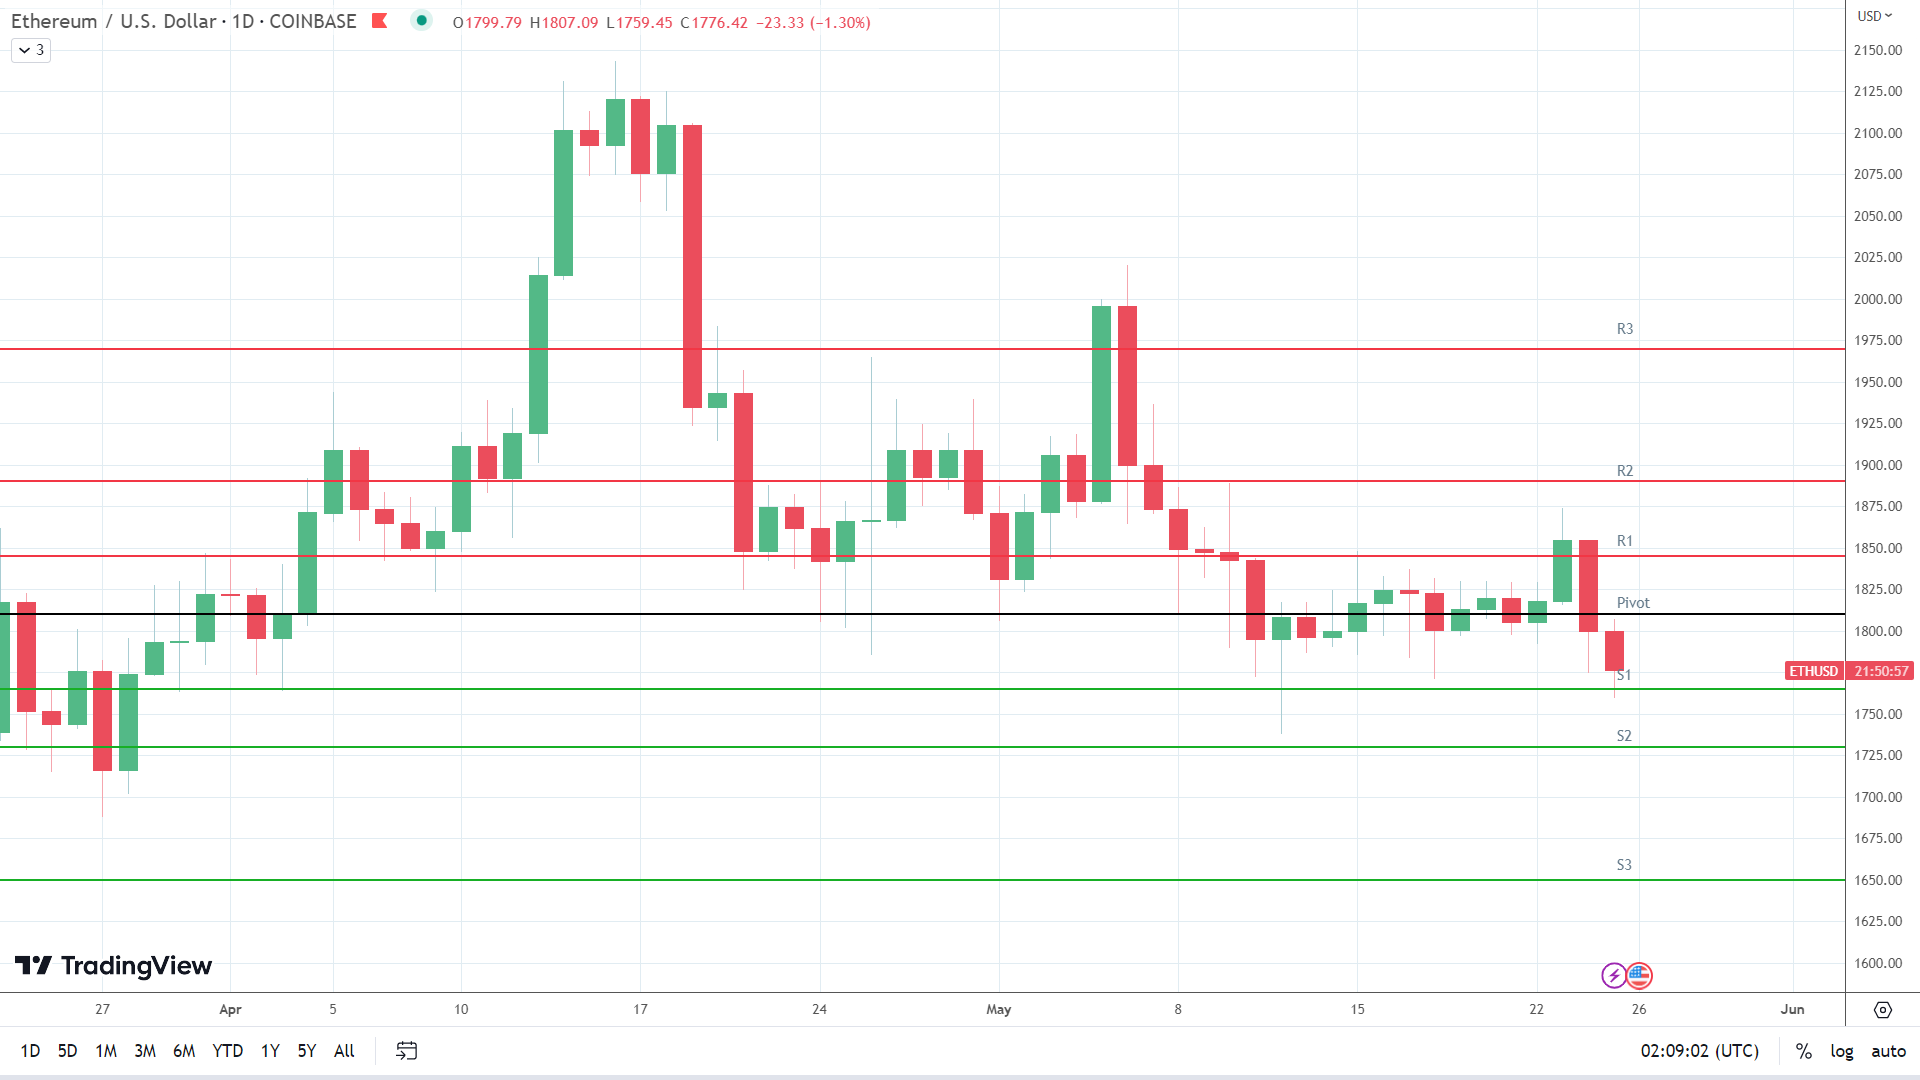
ETH needs to move through the $1,810 pivot to target the First Major Resistance Level (R1) at $1,845 and the Wednesday high of $1,855. A move through the morning high of $1,807 would signal a breakout session. However, staking statistics and US debt ceiling updates must support a bullish session.
In the event of an extended rally, the bulls would likely test the Second Major Resistance Level (R2) at $1,890 and resistance at $1,900. The Third Major Resistance Level (R3) sits at $1,970.
Failure to move through the pivot would leave the First Major Support Level (S1) at $1,765 in play. However, barring a risk-off-fueled sell-off, ETH should avoid sub-$1,700. The Second Major Support Level (S2) at $1,730 should limit the downside. The Third Major Support Level (S3) sits at $1,650.
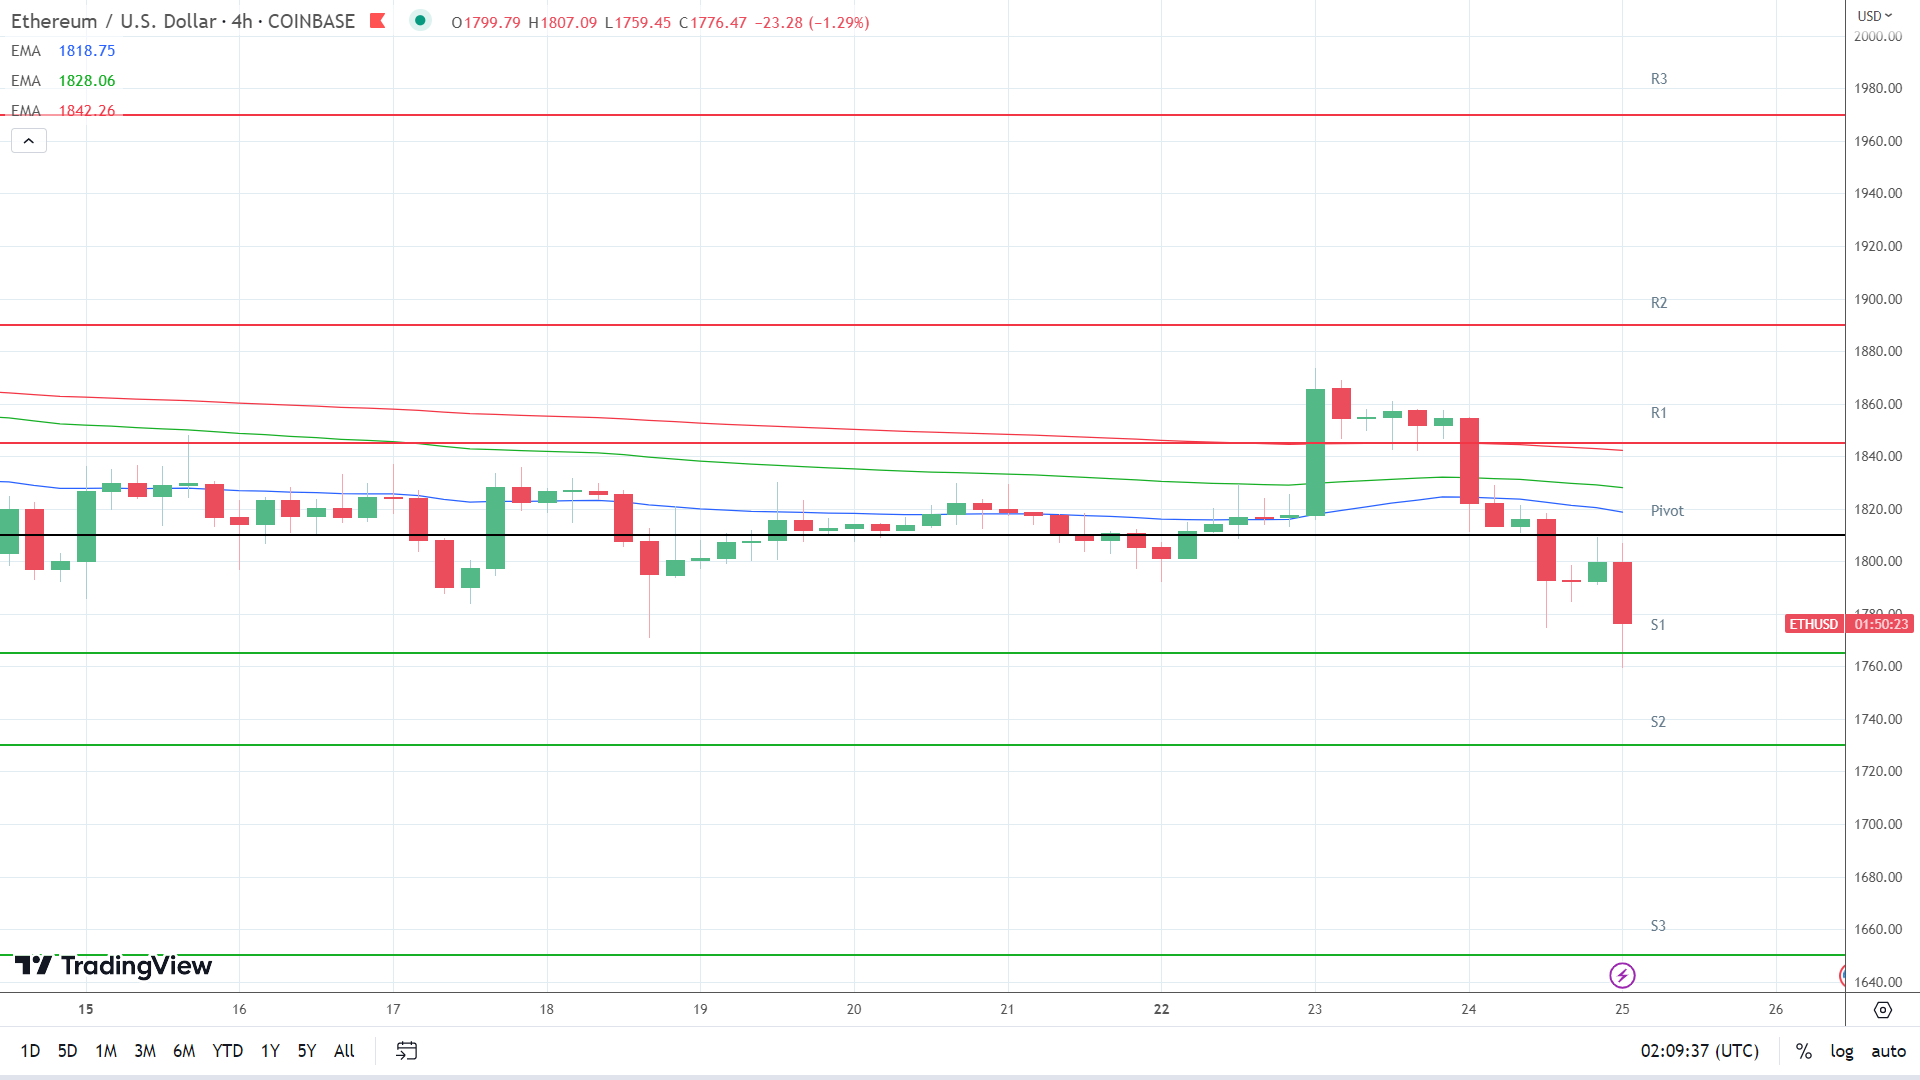
Looking at the EMAs and the 4-hourly candlestick chart (below), it was a bearish signal. Ethereum sat below the 50-day EMA, currently at $1,819. The 50-day EMA pulled back from the 100-day EMA, with the 100-day EMA easing back from the 200-day EMA, delivering bearish signals.
A move through the 50-day ($1,819) and 100-day ($1,828) EMAs would support a breakout from the 200-day EMA ($1,842) and R1 ($1,845) to target R2 ($1,890). However, failure to move through the 50-day EMA ($1,819) would leave S1 ($1,765) and sub-$1,750 Major Support Levels in view.
A move through the 50-day EMA would send a bullish signal.
About the Author
Bob Masonauthor
With over 20 years of experience in the finance industry, Bob has been managing regional teams across Europe and Asia and focusing on analytics across both corporate and financial institutions. Currently he is covering developments relating to the financial markets, including currencies, commodities, alternative asset classes, and global equities.
Did you find this article useful?
Latest news and analysis


Advertisement