
Advertisement
Advertisement
BTC and Sub-$25,000 Hinge on US Debt Ceiling Talks
By:
BTC was in recovery mode this morning, with investors considering oversold conditions. However, US stats and debt ceiling news will influence the afternoon.

In this article:
Key Insights:
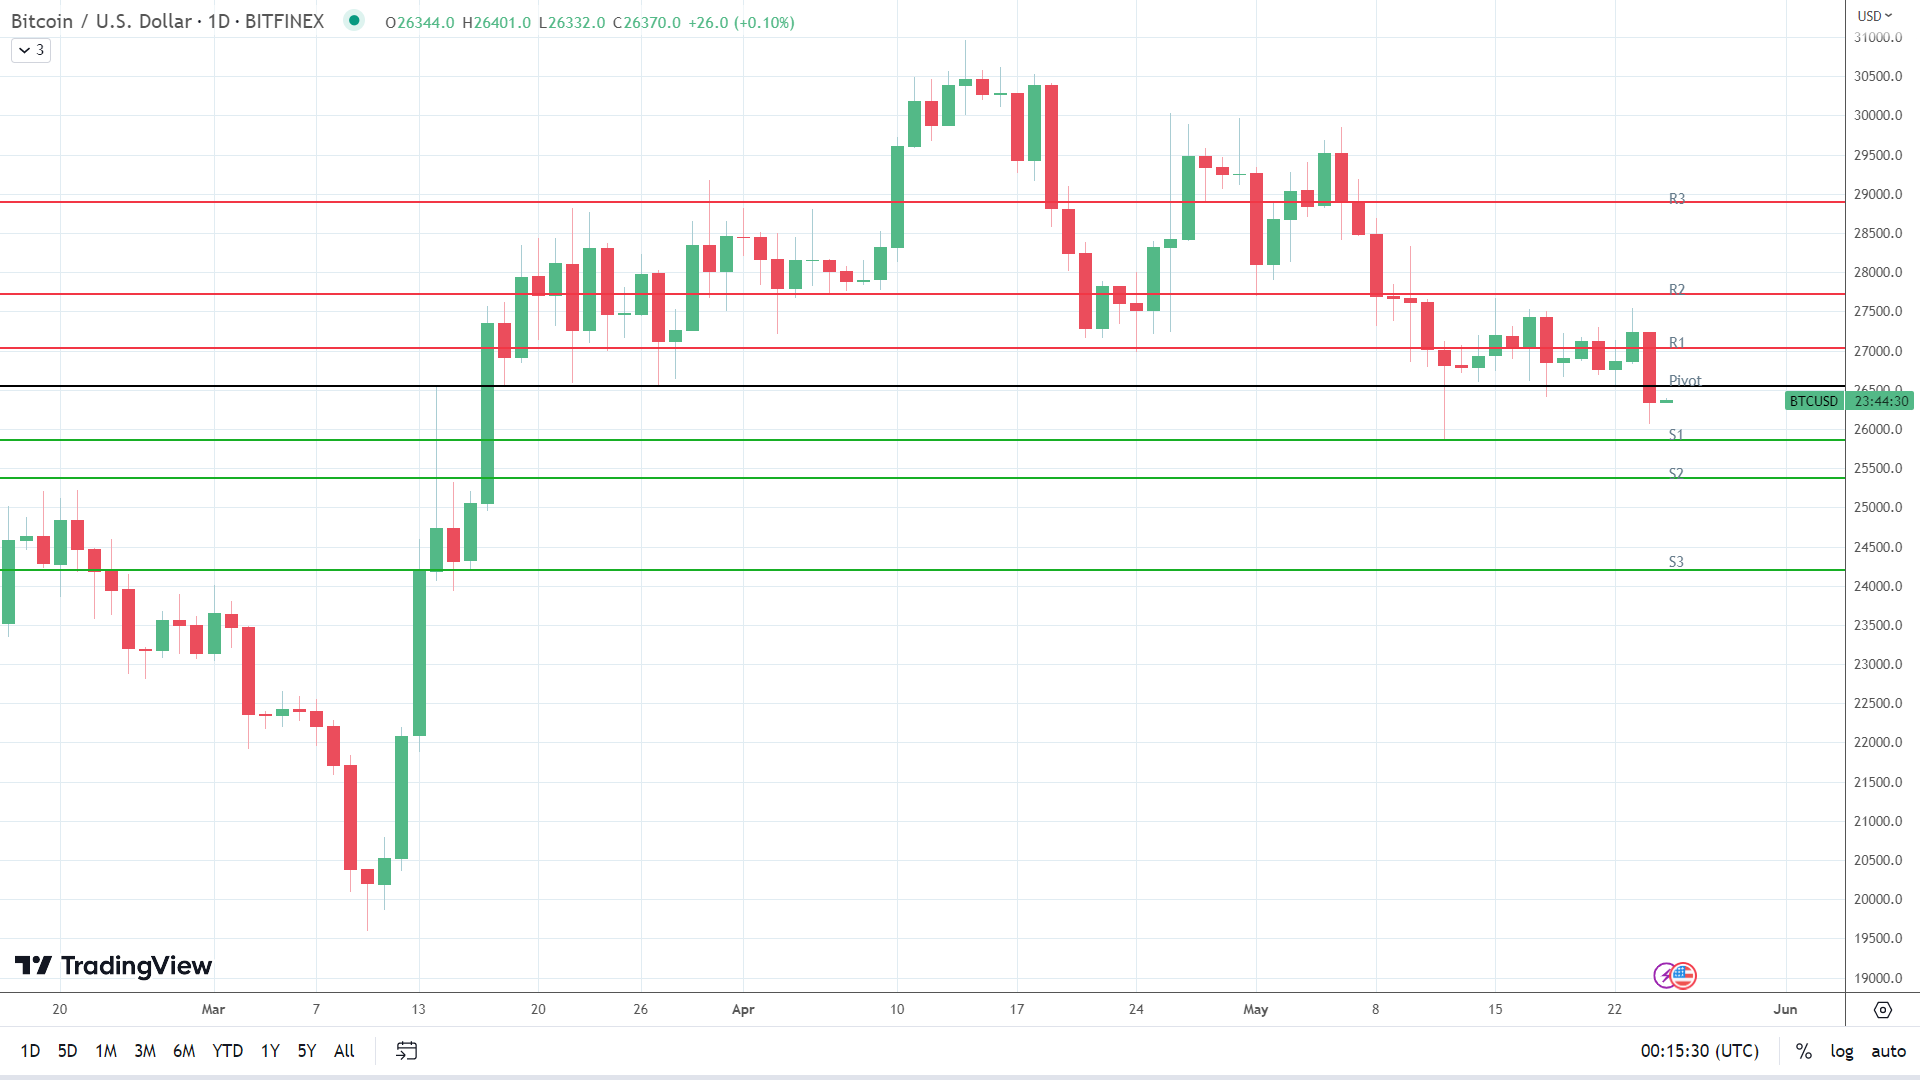
- On Wednesday, BTC slid by 3.30% to end the day at $26,344.
- Investor jitters over the ongoing US debt crisis and rising bets of a June Fed rate hike weighed on investor sentiment.
- The technical indicators are bearish, signaling a fall to sub-$25,000.
On Wednesday, bitcoin (BTC) slid by 3.30%. Reversing a 1.39% gain from Tuesday, BTC ended the day at $26,344. Significantly, BTC tested support at $26,000 for the first time since May 12.
Bearish throughout the day, BTC fell from an early high of $27,239 to a mid-afternoon low of $26,067. BTC fell through the First Major Support Level (S1) at $26,867 and the Second Major Support Level (S2) at $26,491 to end the day at $26,344.
US Debt Ceiling Woes and the Fed Send BTC South
There were no crypto events to move the dial on Wednesday. The lack of crypto-related news left BTC in the hands of the US economic calendar and debt ceiling talks.
A failure by the US administration and Republicans to reach a deal on the debt ceiling weighed on riskier assets. The lack of progress toward a debt ceiling deal raised the prospects of a US default that could see BTC reverse gains from the year.
Late in the US session, the FOMC meeting minutes also tested buyer appetite.
The FOMC meeting minutes gave no surprises to distract investors from the debt ceiling crisis. There were no firm indications of what investors should expect in June. However, FOMC members raised concerns about the debt ceiling.
According to the CME FedWatch Tool, the probability of a 25-basis point Fed interest rate hike in June stood at 36.4%, up from 28.1% on Tuesday. The FOMC meeting minutes did not write off a June interest rate hike, with concerns over inflation raising bets on a June move.
On Wednesday, the Dow and the S&P 500 saw losses of 0.77% and 0.73%, respectively, with the NASDAQ Composite Index falling by 0.61%. This morning, the NASDAQ mini was up 195 points.

The Day Ahead
It is a busier Thursday session. US GDP and initial jobless claims will move the dial this afternoon. However, market sensitivity to the stats will hinge on US debt ceiling-related news. A continued failure to progress toward a deal would weigh on BTC and the broader crypto market.
Investors should also track SEC v Ripple updates and Binance and Coinbase (COIN)-related news.
Bitcoin (BTC) Price Action
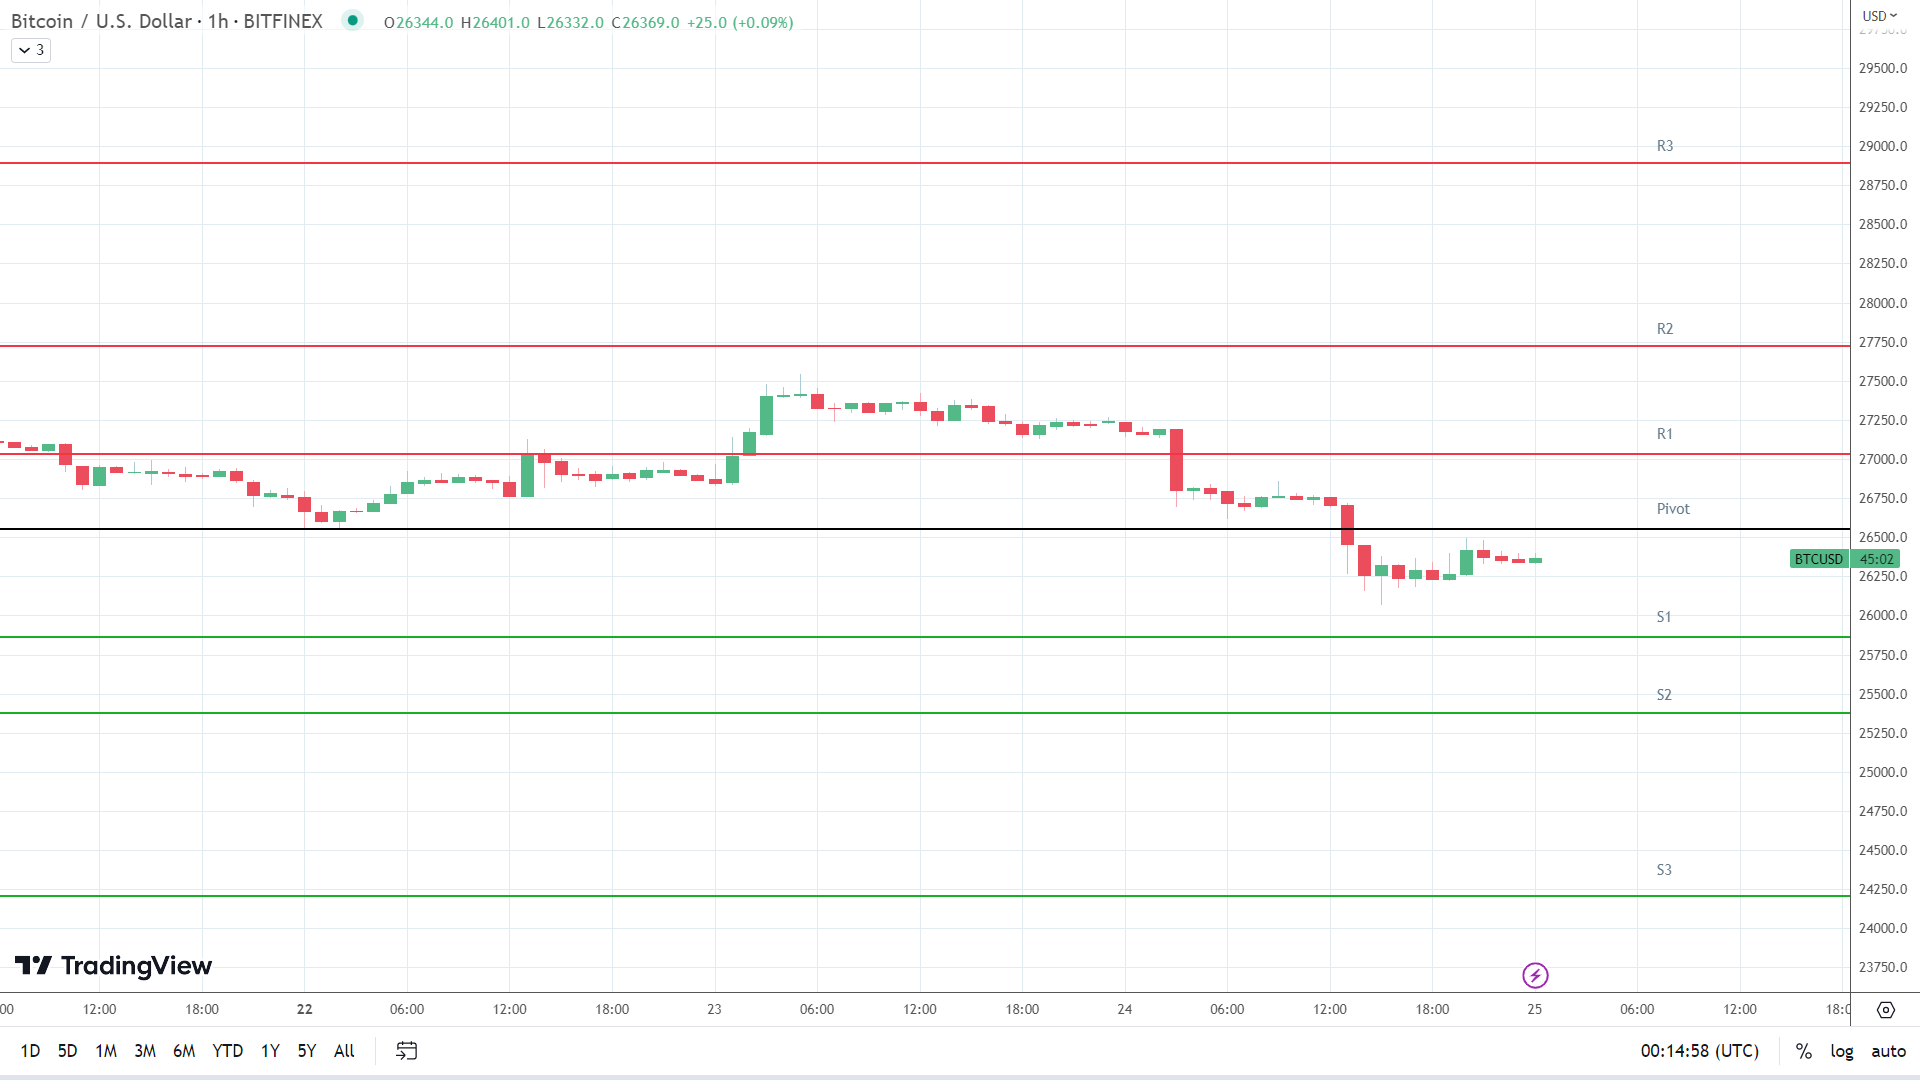
This morning, BTC was up 0.10% to $26,370. A mixed start to the day saw BTC rise to an early high of $26,401 before falling to a low of $26,332.
Technical Indicators
Resistance & Support Levels
| R1 – $ | 27,033 | S1 – $ | 25,861 |
| R2 – $ | 27,722 | S2 – $ | 25,378 |
| R3 – $ | 28,894 | S3 – $ | 24,206 |
BTC needs to move through the $26,550 pivot to target the First Major Resistance Level (R1) at $27,033 and the Wednesday high of $27,239. A return to $26,500 would signal an extended bullish session. The US economic indicators and US debt ceiling-related news should be crypto-friendly to support an extended rally.
In the event of an extended rally, BTC would likely test the Second Major Resistance Level (R2) at $27,722 and resistance at $28,000. The Third Major Resistance Level (R3) sits at $28,894.
Failure to move through the pivot would leave the First Major Support Level (S1) at $25,861 in play. However, barring another risk-off-fueled sell-off, BTC should avoid sub-$25,000. The Second Major Support Level (S2) at $25,378 should limit the downside. The Third Major Support Level (S3) sits at $24,206.
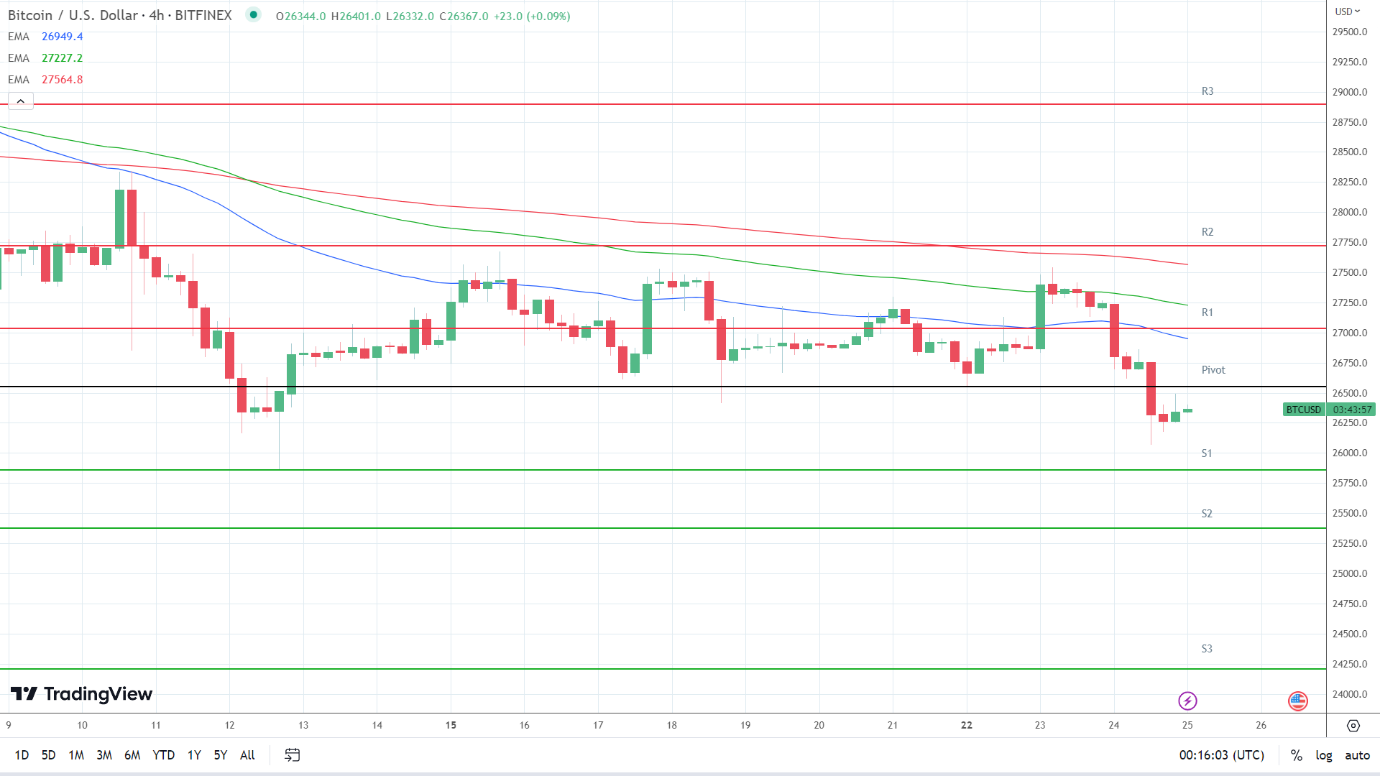
Looking at the EMAs and the 4-hourly candlestick chart (below), the EMAs are bearish. BTC sat below the 50-day EMA ($26,949). The 50-day EMA fell back from the 100-day EMA, with the 100-day EMA easing back from the 200-day EMA, sending bearish signals.
A move through the 50-day EMA ($26,949) would support a breakout from R1 ($27,033) to give the bulls a run at the 100-day ($27,227) and 200-day ($27,565) EMAs and R2 ($27,722). However, failure to move through the 50-day EMA ($26,949) would leave S1 ($25,861) in view. A move through the 50-day EMA would send a bullish signal.
About the Author
Bob Masonauthor
With over 20 years of experience in the finance industry, Bob has been managing regional teams across Europe and Asia and focusing on analytics across both corporate and financial institutions. Currently he is covering developments relating to the financial markets, including currencies, commodities, alternative asset classes, and global equities.
Did you find this article useful?
Latest news and analysis


Advertisement