


My counters: The latest round of Fed tightening has occurred in the wake of a massive and unprecedented increase in the M2 money supply that has been mostly—but not completely—reversed. A $6 trillion jump in M2 was responsible for the recent surge in inflation, but there is still a small "surplus" of M2 that is helping to cushion the otherwise destructive impact of the Fed's massive monetary tightening. In addition, the spending cuts that are proposed should boost confidence and improve the economic outlook because they imply lower tax burdens and a more efficient economy.
In my view, an economic "soft landing" with lower inflation is entirely possible. Soon, it should become obvious that the Fed can begin to relax monetary policy. If the Fed delays too long, however, then the risk of deflation next year will rise.
Chart #1

Chart #1 compares the growth rate of M2 with the year over year rate of inflation according to the Consumer Price Index. I have shifted the CPI line one year to the left, in order to show how changes in M2 growth have preceded changes in inflation. The chart strongly suggests that the CPI should continue to fall over the next 6-9 months.
Chart #2

I have featured Chart #2 for several years now, and it continues to be highly relevant to today's environment. It compares the actual level of M2 (blue line) with the 6% per annum growth rate which prevailed from 1995 through the pre-Covid period. The y-axis is logarithmic, which shows constant rates of growth as straight lines. As of last April, the "gap" or "surplus" amount of M2 relative to its long-term trend was about half what it was at its peak in 12/21. That means, in effect, that about half of the abnormal growth in M2 has fueled higher inflation and a larger economy. However, as Chart #5 below suggests, the effective gap or surplus of M2 could be less than is shown here.
Chart #3

Chart #3 is similar to Chart #2, but it shows only the currency component of M2, which currently represents about 10% of the total. The long-term trend growth rate of currency is 6.6%, slightly higher than M2 because US currency (mainly $100 bills) is increasingly used in developing countries (e.g., Argentina). The "gap" or surplus amount of currency today is only $80 billion by this measure. Both charts suggest that the monetary fuel behind our recent inflation surge is being depleted.
Chart #4
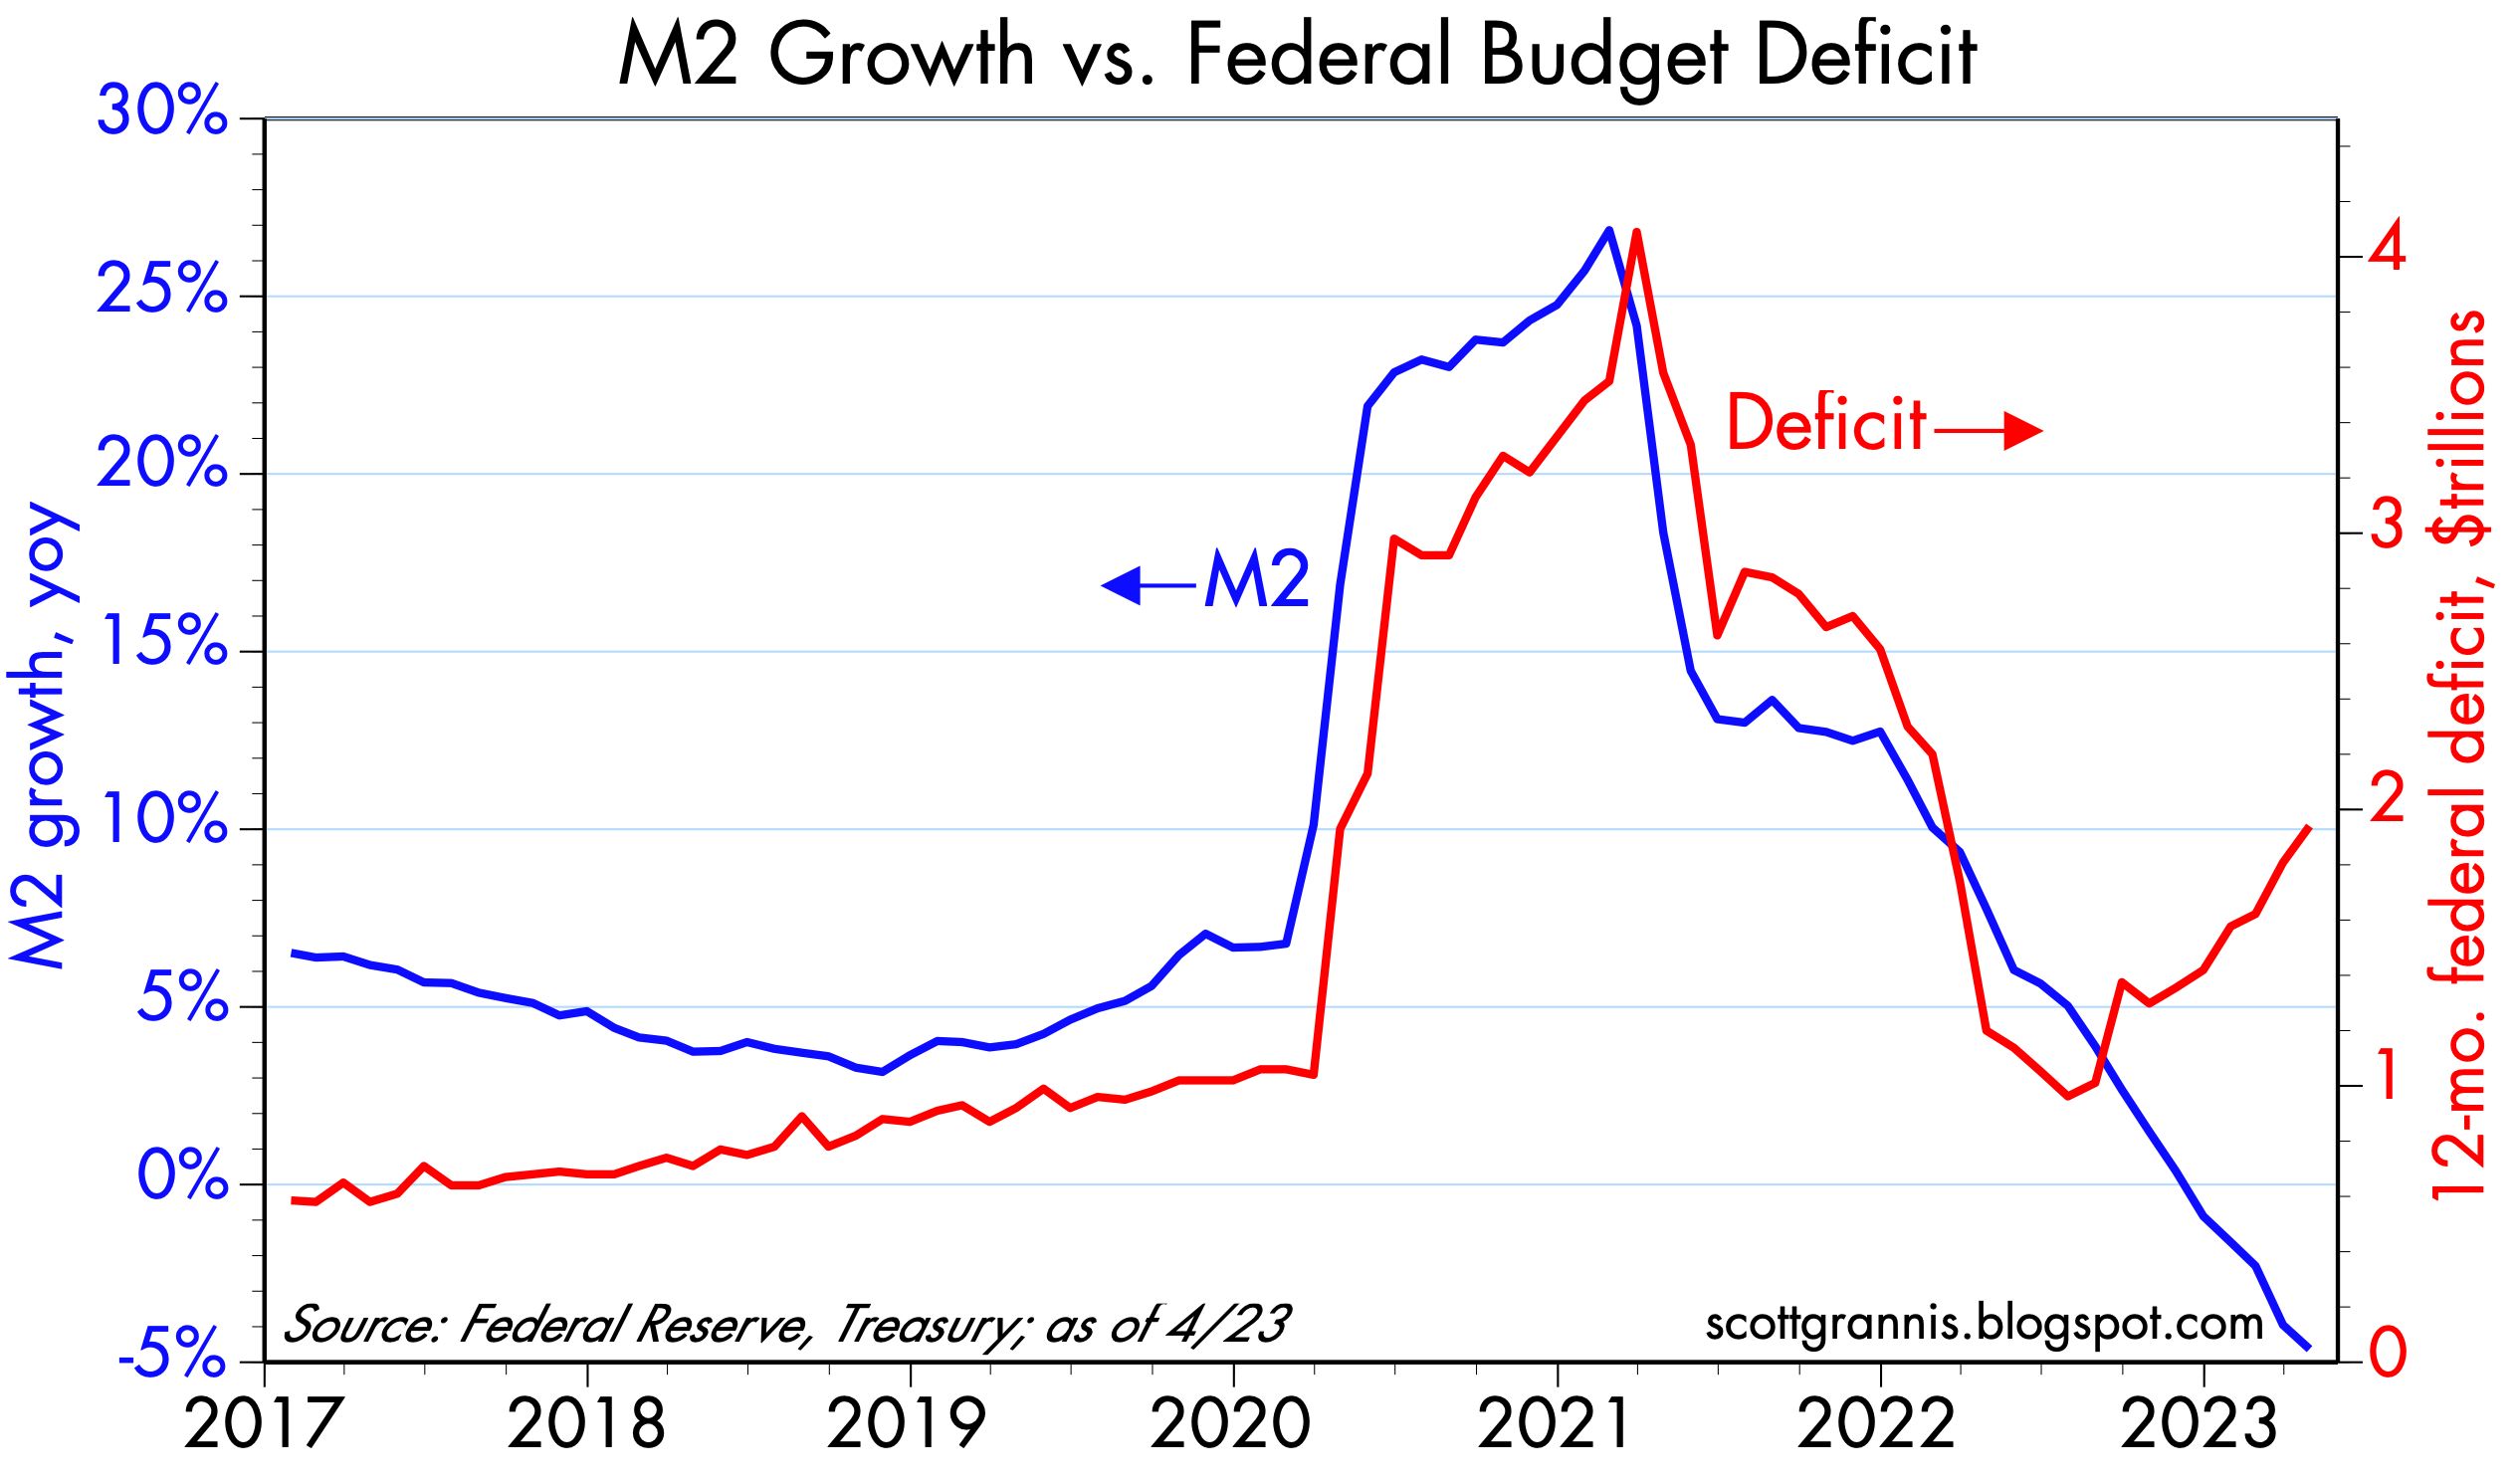
Chart #4 compares the growth of M2 with the level of the federal budget deficit. Here it should be obvious that the roughly $6 trillion of Covid "stimulus" spending was effectively monetized. It's critical also to note that the $1 trillion increase in deficit spending since last July has NOT been monetized. That all but eliminates the threat of further increases in inflation going forward.
Chart #5

Chart #5 shows the ratio of M2 to nominal GDP. It's a good proxy for what I call "money demand," since it can be described as the portion of the average person's annual income that is held in cash or cash equivalents (i.e., currency, bank CDs, time deposits, and savings accounts). Money demand soared as the Covid lockdowns spread and the government showered people with "stimulus" funds. It was hard to spend money back then, and most people were terribly worried about the future, so most of the stimulus checks just sat in people's bank accounts. But once the Covid panic eased, beginning in early 2021, people began to spend the money they had accumulated. Much of that extra spending, coming at a time of supply bottlenecks, sparked higher prices (i.e., inflation) and the rest helped the economy to recover (i.e., it helped fuel renewed growth).
If present trends continue, the demand for money (as calculated in Chart #5) could return to pre-Covid levels by the end of this year. That further implies that the "surplus" of M2 could essentially disappear within the next 7 months, having been entirely absorbed by rising prices and a larger economy.
Technical note: money demand as shown here (M2 divided by nominal GDP) is the inverse of money velocity. Plunging money demand is the same as soaring money velocity. Instead of sitting in bank deposits, money these days is circulating more rapidly and thus supporting a rising level of nominal GDP.
1 comment:
Every recession since WWII was both predictable and preventable. But today, since Powell eliminated reserve requirements, it’s a little harder.
The 6-month rate-of-change in money flows, the volume and velocity of our means-of-payment money supply, became negative in January.
The 10-month roc (proxy for the real output of goods and services), turns negative in May (numbers not yet released). If the present tightening continues, we will enter a mild recession in the 2nd qtr.
Post a Comment