
Advertisement
Advertisement
ETH Eyes $2,000 as Staking Inflows Surge Amidst a US Banking Crisis
By:
ETH enjoyed a bullish session on Friday. Staking inflows were on the rise in response to the Shapella upgrade date and US banking sector woes.

In this article:
Key Insights:
- On Friday, ethereum (ETH) rose by 6.98% to end the day at $1,794.
- Investor sentiment toward the Shapella upgrade and a simmering US banking sector crisis delivered support.
- The technical indicators remained bullish, with $2,000 in view.
Ethereum (ETH) rallied by 6.98% on Friday. Following a 1.21% gain on Thursday, ETH ended the day at $1,794. Significantly, ETH revisited the $1,800 handle for the first time since August 2022.
A mixed start to the day saw ETH fall to an early low of $1,666. Steering clear of the Frist Major Support Level (S1) at $1,645, ETH struck a final-hour high of $1,804 before easing back. ETH broke through the Major Resistance Levels to wrap up the day at $1,794.
US Banking Sector Woes Drive ETH Staking Inflows Higher
There were no further updates from Ethereum developers on the Shapella upgrade following the All Core Developers Execution Layer (ACDE) call and the announcement of an April 12 Shapella Upgrade target date. While developers previously aimed to roll out the upgrade in March, investors were not too disappointed with a mid-April upgrade.
Prevailing market conditions raise the prospects of a bullish ETH response to the April upgrade. After the upgrade, stakers can withdraw staked ETH from the Beacon Chain, which went live in December 2020.
After the Shapella upgrade, a slide in total ETH value staked, and an influx of ETH to exchanges could lead to a bearish ETH response. However, the latest staking inflow numbers suggest a bullish trend as the Federal Reserve attempts to contain a US banking crisis.
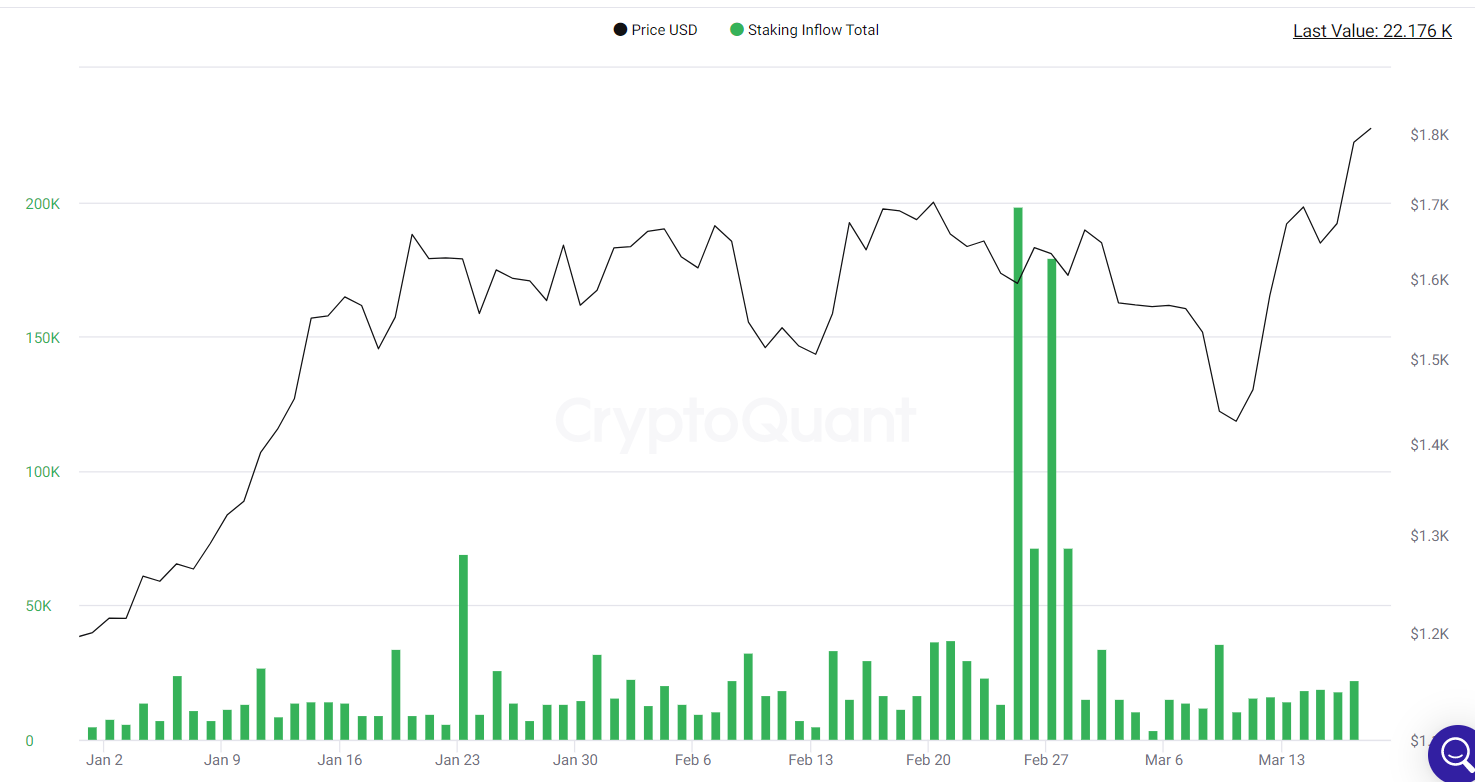
According to CryptoQuant, staking inflows jumped higher on Friday in response to an ETH return to $1,800. Staking inflows increased from 18,208 ETH on Thursday to 22,176 ETH on Friday. Above 20,000 levels should be a bullish signal considering historical staking inflow levels.
However, investors should continue to monitor staking inflows and total value staked numbers. A sharp decline would signal a shift in investor sentiment.
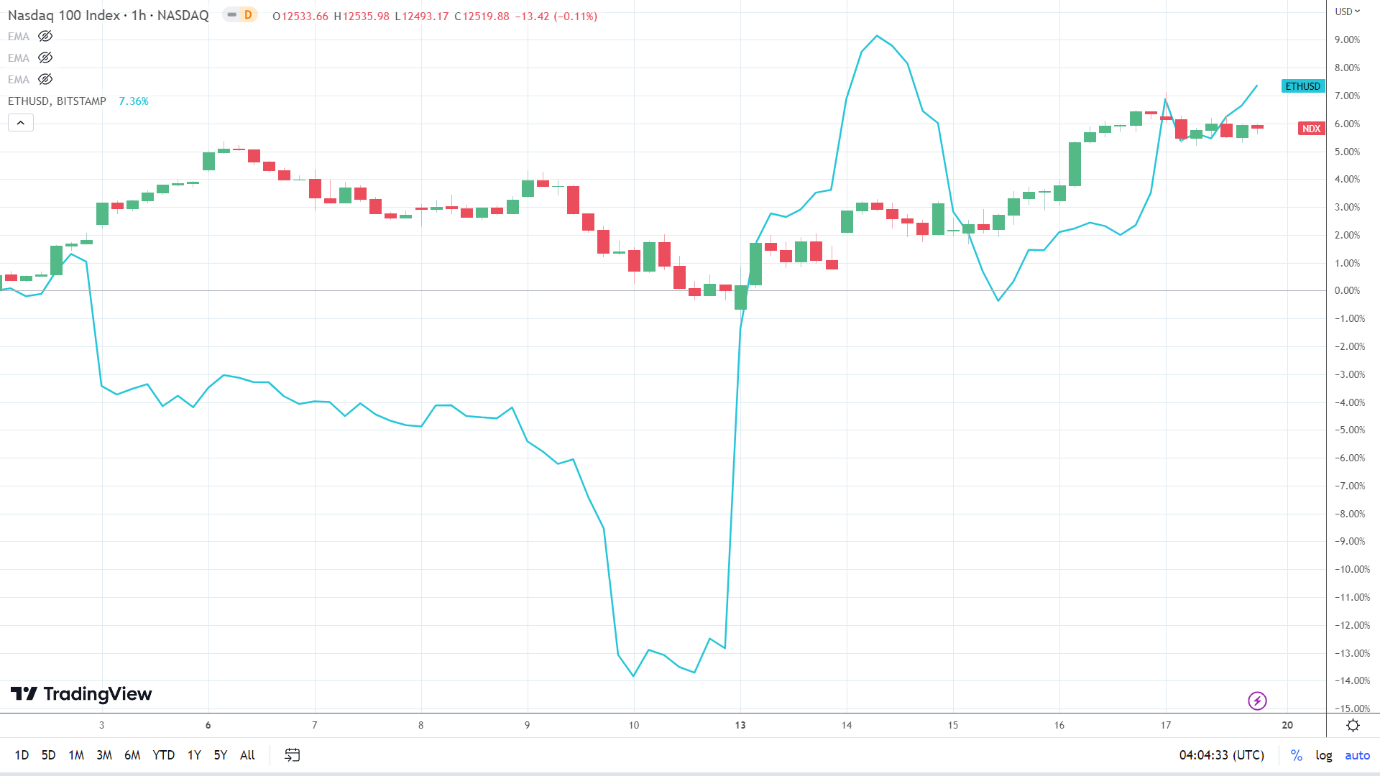
On Friday, ETH joined the broader crypto market in a breakout session. The news of SV Financial Group (SIVB) filing for bankruptcy protection, Fed bailouts rising beyond levels seen during the global financial crisis, and 11 banks bailing out First Republic Bank drove demand for crypto assets.
Bitcoin (BTC) surged by 9.14%, with the crypto market cap jumping by 7.32% ($77.35 billion) to $1,134 billion. In contrast, the NASDAQ Composite Index fell by 0.74%, with the Dow and S&P 500 seeing losses of 1.19% and 1.10%, respectively.
The Day Ahead
Shapella upgrade news will continue to provide direction as investors prepare for the April 12 upgrade.
Investors should also monitor the crypto news wires, with regulatory activity and US lawmaker chatter focal points. A quiet session would leave Binance, FTX, and updates from the ongoing SEC v Ripple case to move the dial.
Beyond the digital asset space, further US banking sector-related news also needs consideration.
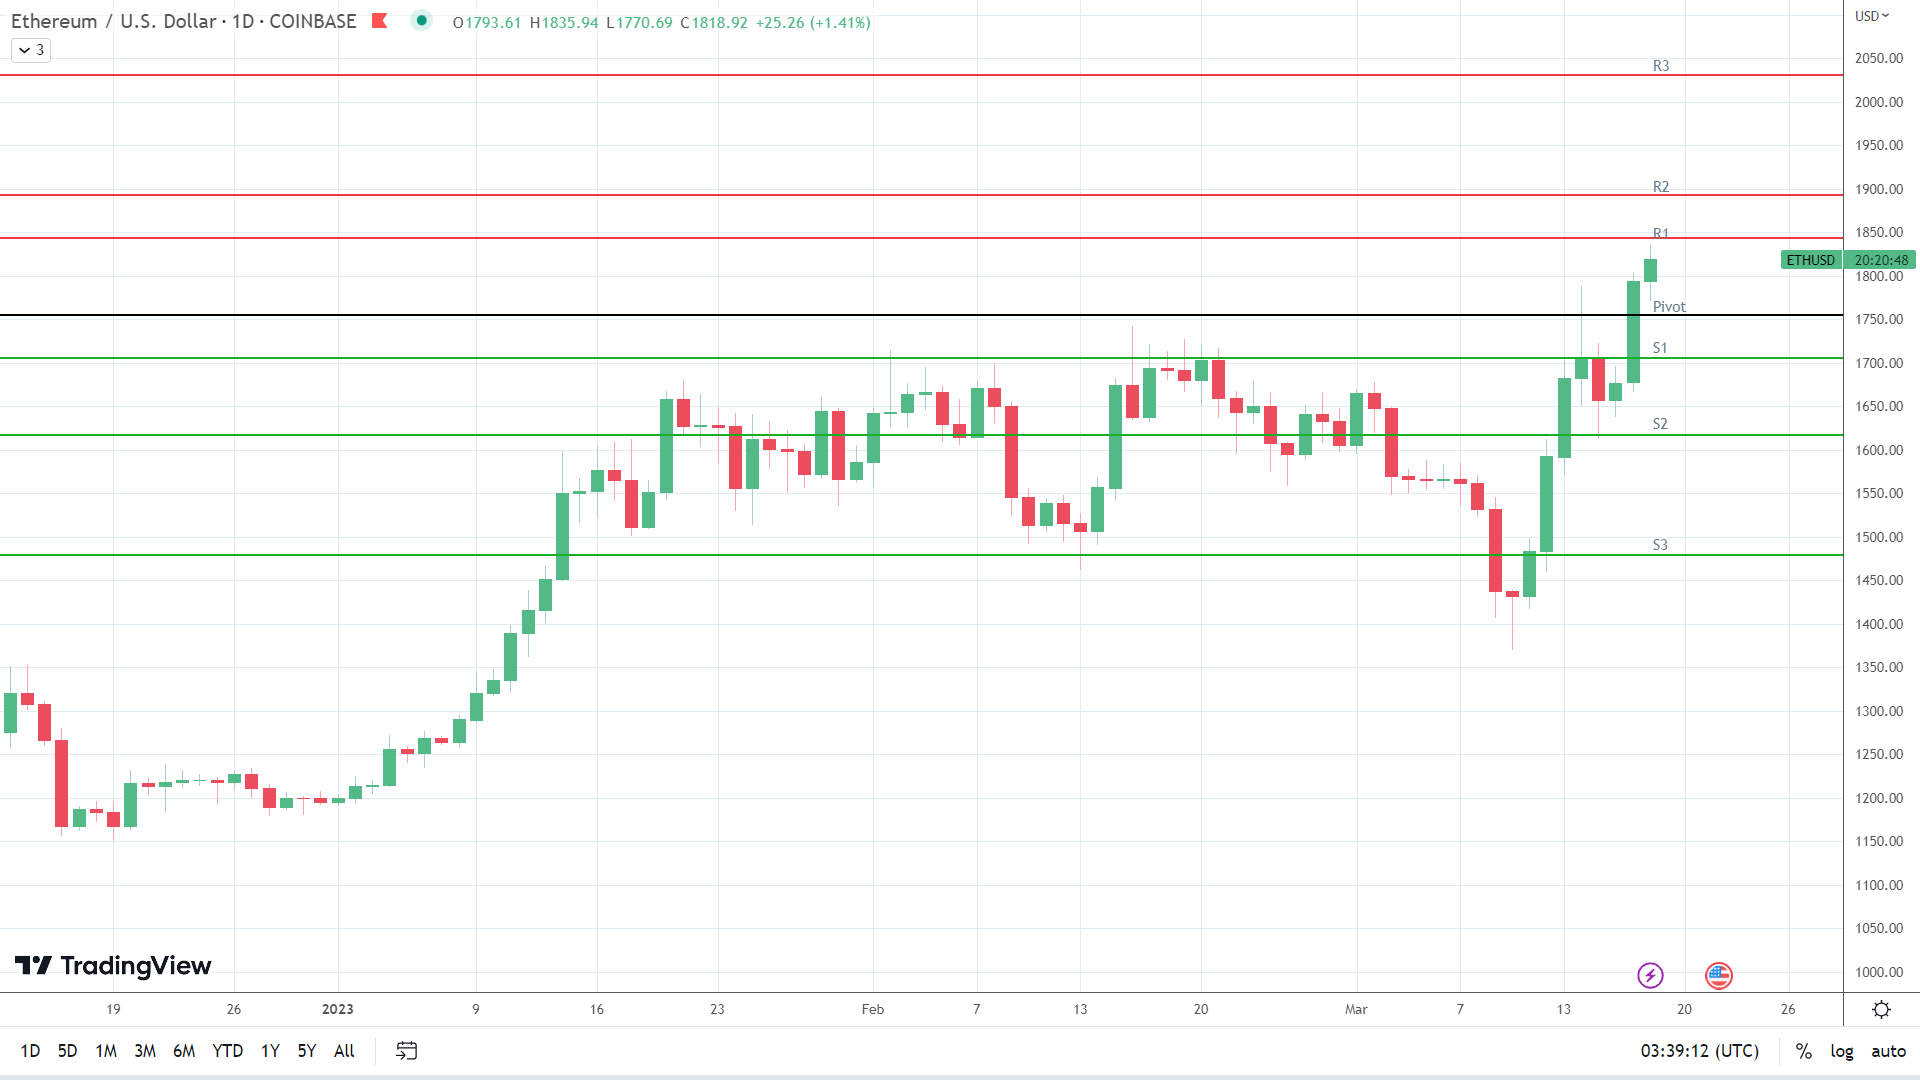
Ethereum (ETH) Price Action
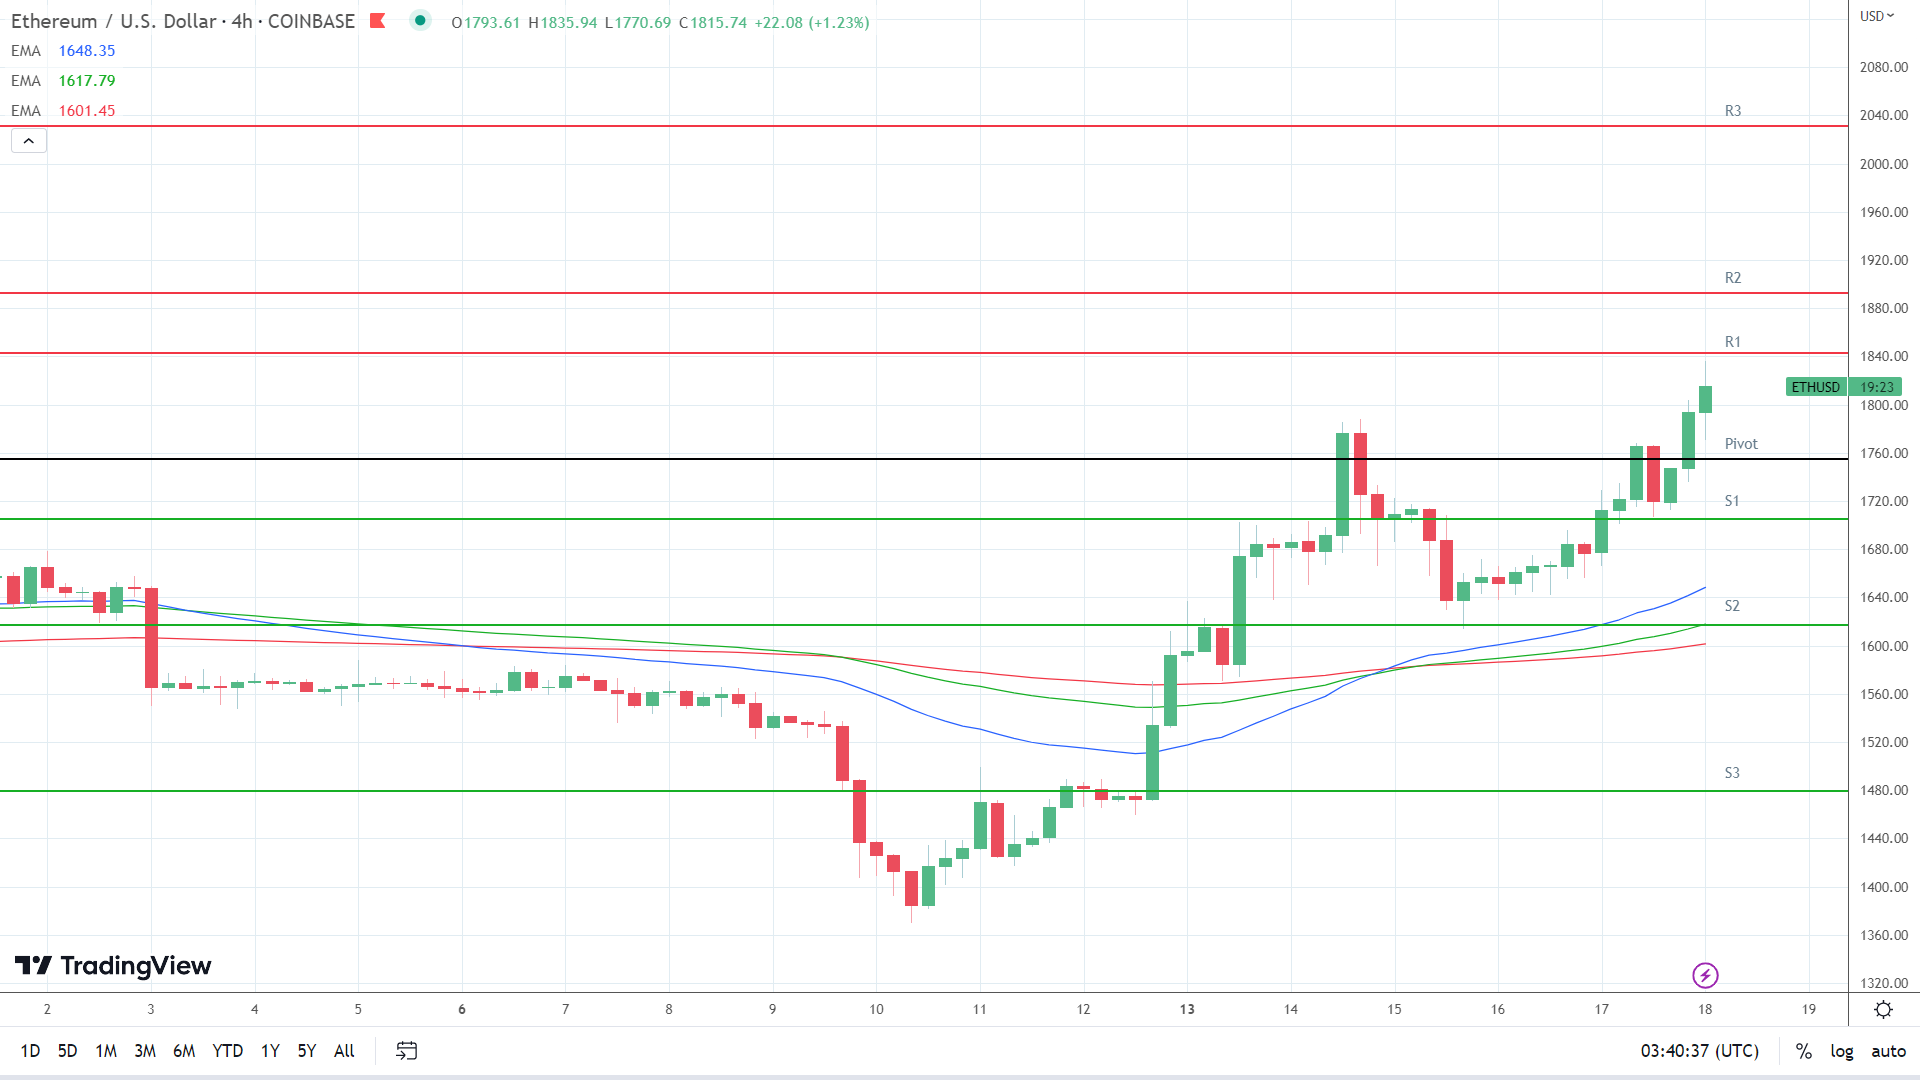
At the time of writing, ETH was up 1.41% to $1,819. A mixed start to the day saw ETH fall to an early low of $1,771 before rising to a high of $1,836.
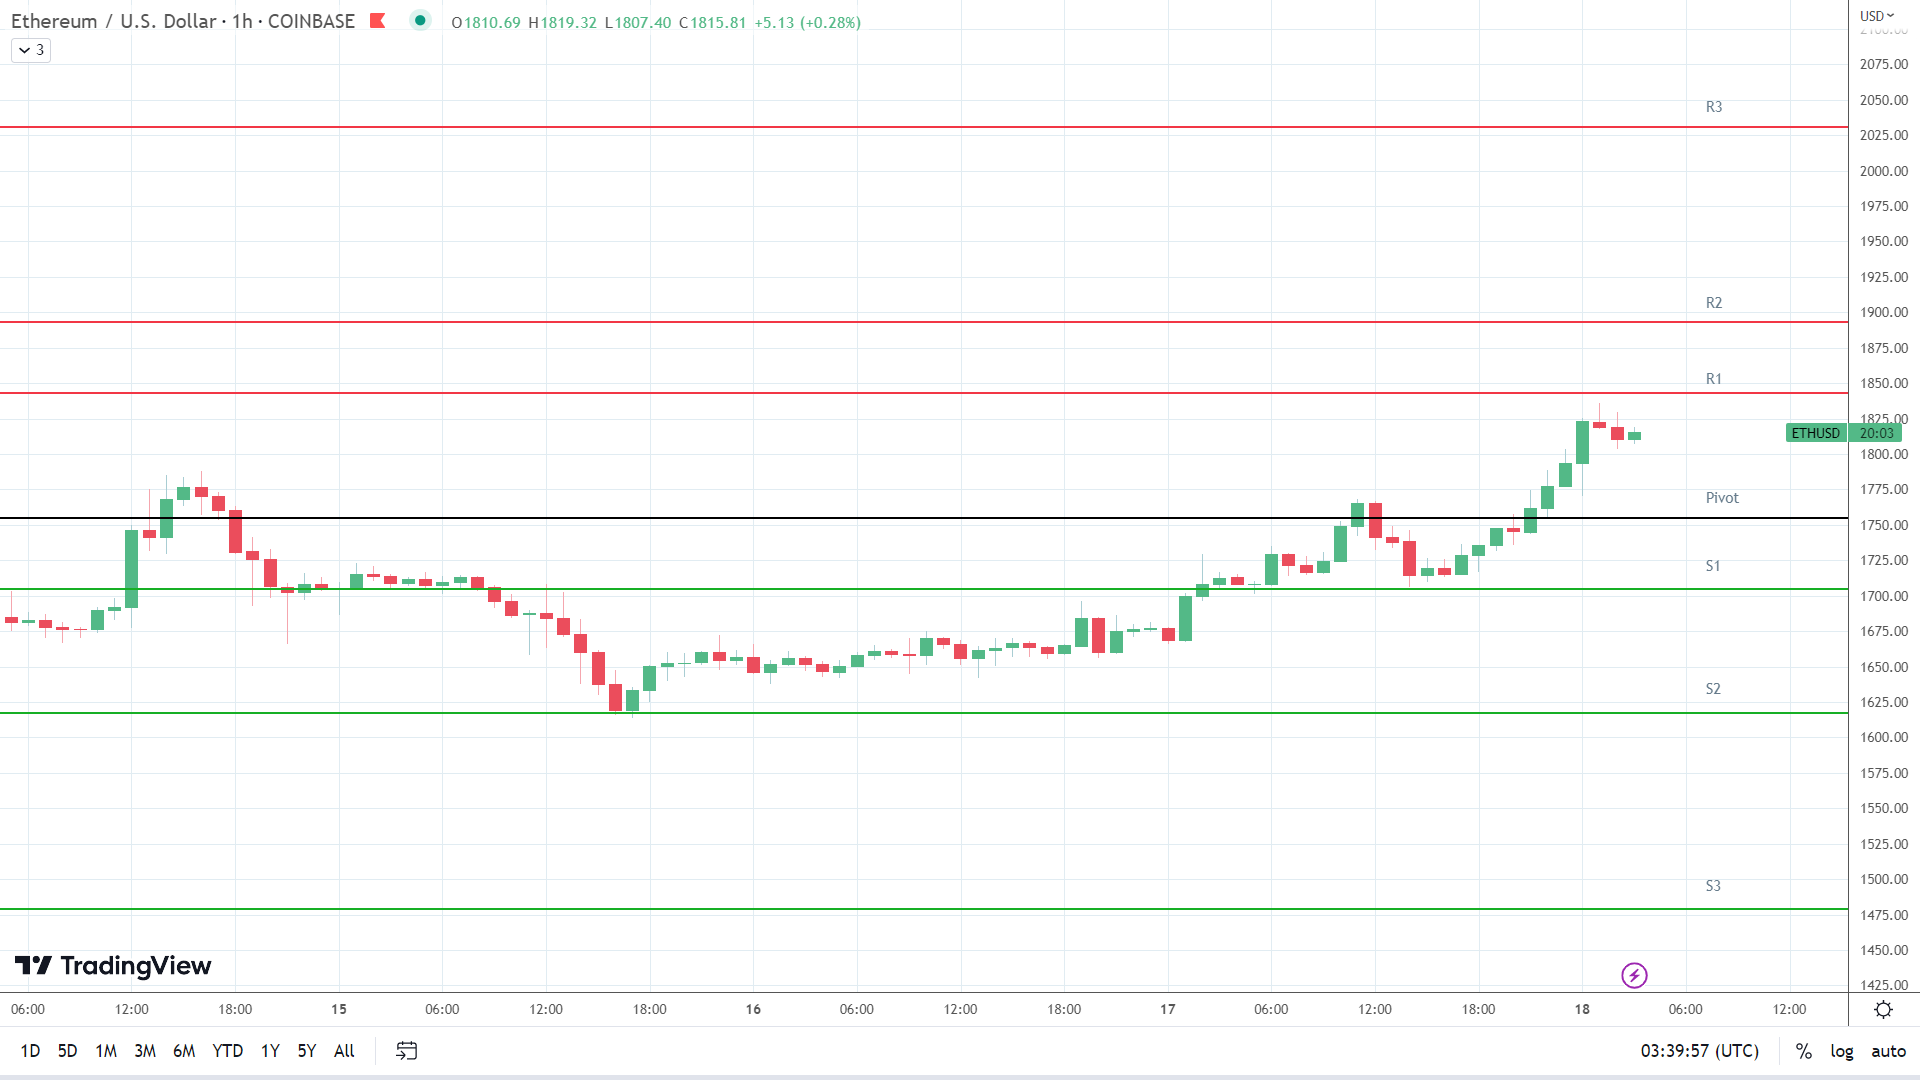
Technical Indicators
ETH needs to avoid the $1,755 pivot to target the First Major Resistance Level (R1) at $1,843. A move through the morning high of $1,836 would signal a breakout session. However, Shanghai upgrade news and the crypto news wires should be ETH-friendly to support a breakout.
In the event of an extended rally, the bulls would likely test the Second Major Resistance Level (R2) at $1,893 and resistance at $1,900. The Third Major Resistance Level (R3) sits at $2,031.
A fall through the pivot would bring the First Major Support Level (S1) at $1,705 into play. However, barring an event-fueled crypto market sell-off, ETH should avoid sub-$1,700 and the Second Major Support Level (S2) at $1,617. The Third Major Support Level (S3) sits at $1,479.
Looking at the EMAs and the 4-hourly candlestick chart (below), it was a bullish signal. Ethereum sat above the 50-day EMA, currently at $1,648. The 50-day EMA pulled further away from the 100-day EMA, with the 100-day EMA widening from the 200-day EMA, delivering bullish signals.
A hold above S1 ($1,705) and the 50-day EMA ($1,648) would support a breakout from R1 ($1,843) to target R2 ($1,893) and $1,900. However, a fall through S1 ($1,706) would give the bears a run at the 50-day ($1,648) and 100-day ($1,618) EMAs and S2 ($1,617). A fall through the 50-day EMA would send a bearish signal.
About the Author
Bob Masonauthor
With over 20 years of experience in the finance industry, Bob has been managing regional teams across Europe and Asia and focusing on analytics across both corporate and financial institutions. Currently he is covering developments relating to the financial markets, including currencies, commodities, alternative asset classes, and global equities.
Did you find this article useful?
Latest news and analysis


Advertisement