
Advertisement
Advertisement
BTC Fear & Greed Index Returns to Neutral on a Bearish BTC Trend
By:
BTC fell for a fifth consecutive day on Monday, dragging the Fear & Greed Index into the Neutral zone. Fed chatter could deliver further losses today.

In this article:
Key Insights:
- It was a bearish Monday, with BTC falling by 0.77% to end the day at $22,755.
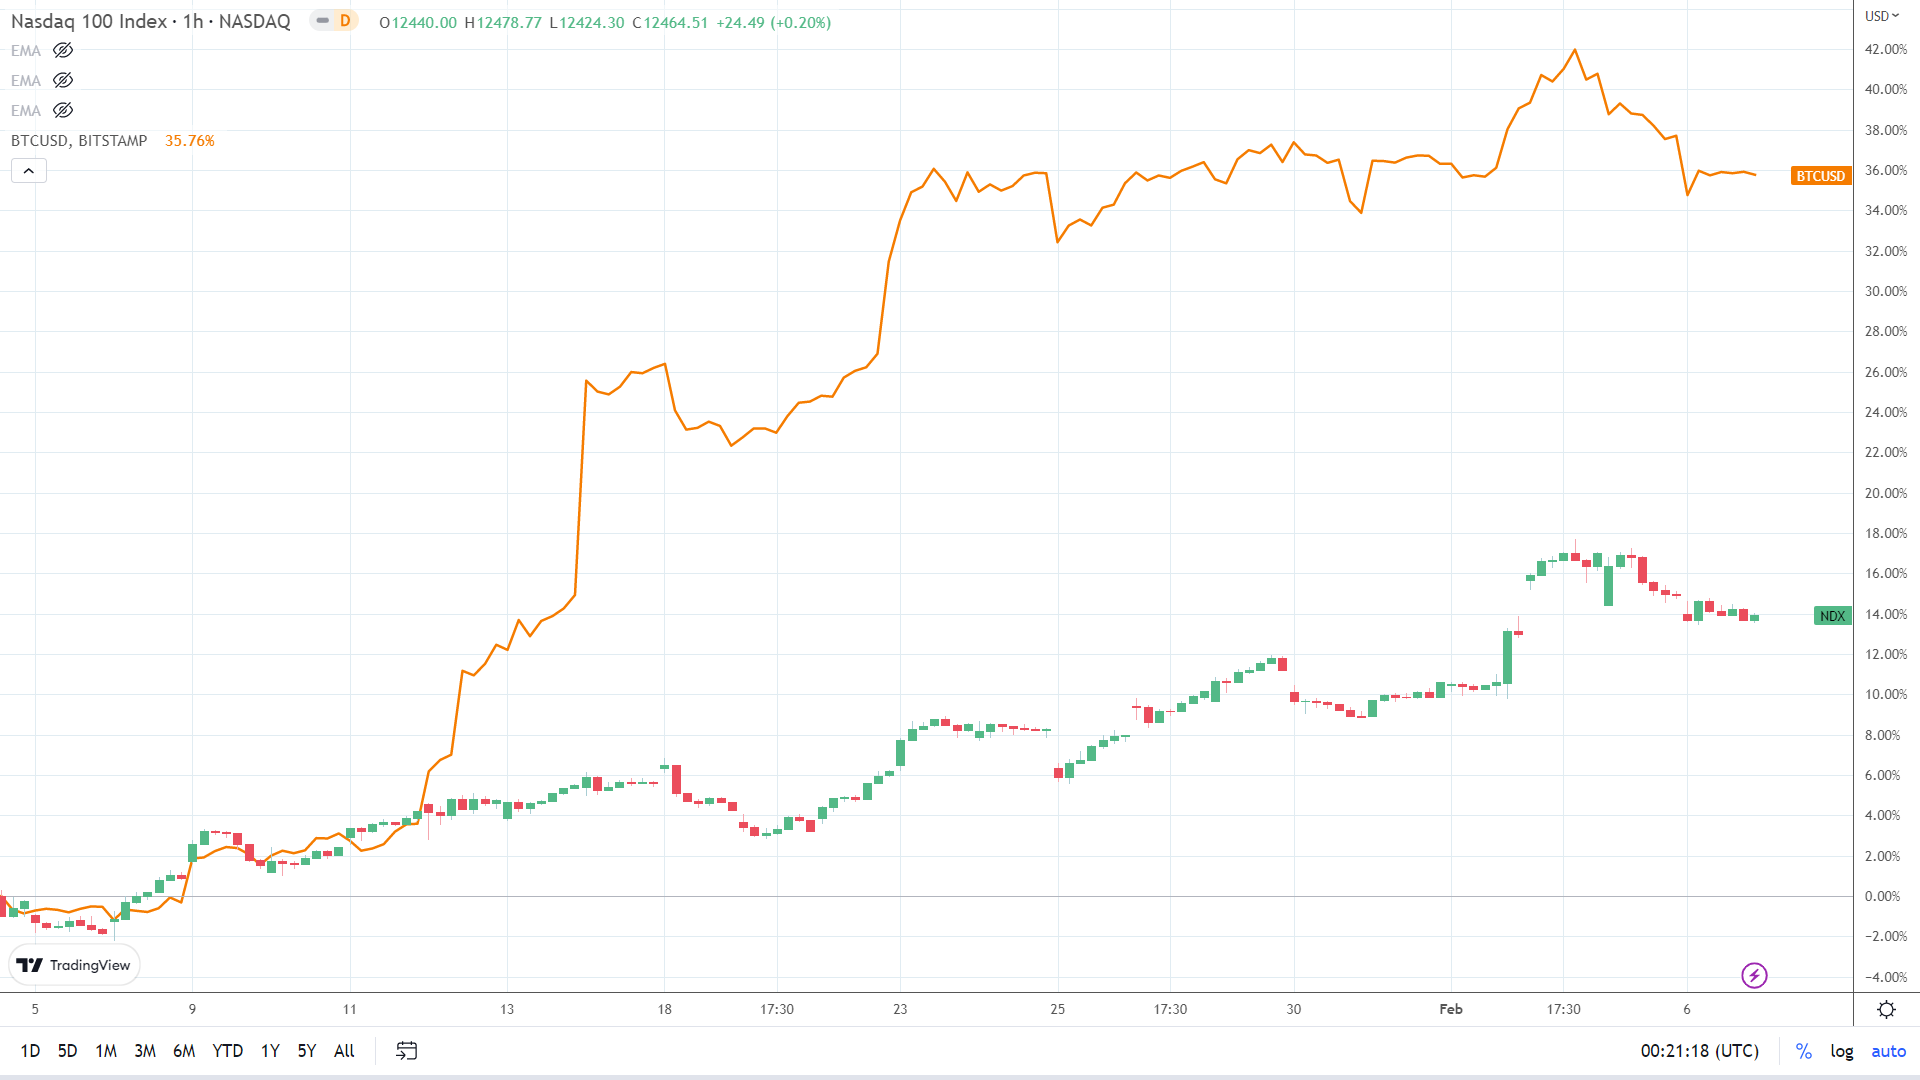
- Fed Fear continued to weigh on the NASDAQ Index and the broader crypto market following the January US Jobs Report.
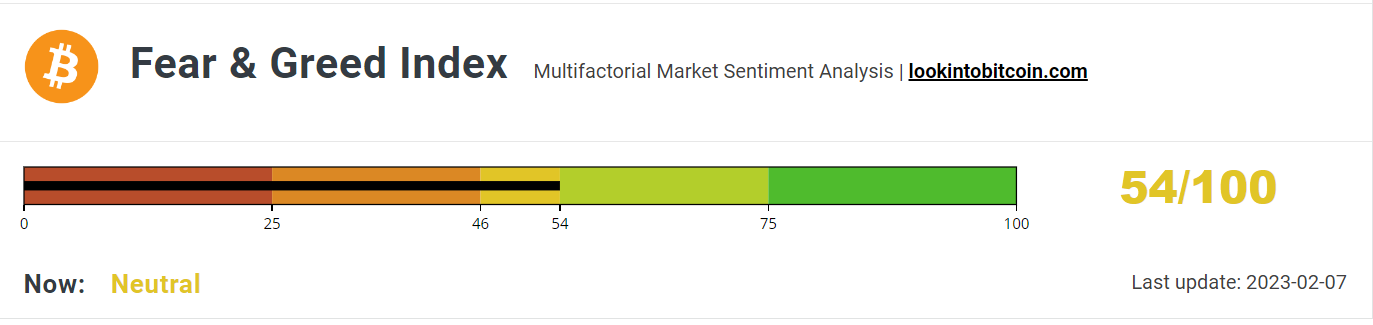
- The Fear & Greed Index returned to the Neutral zone, falling from 56/100 to 54/100.
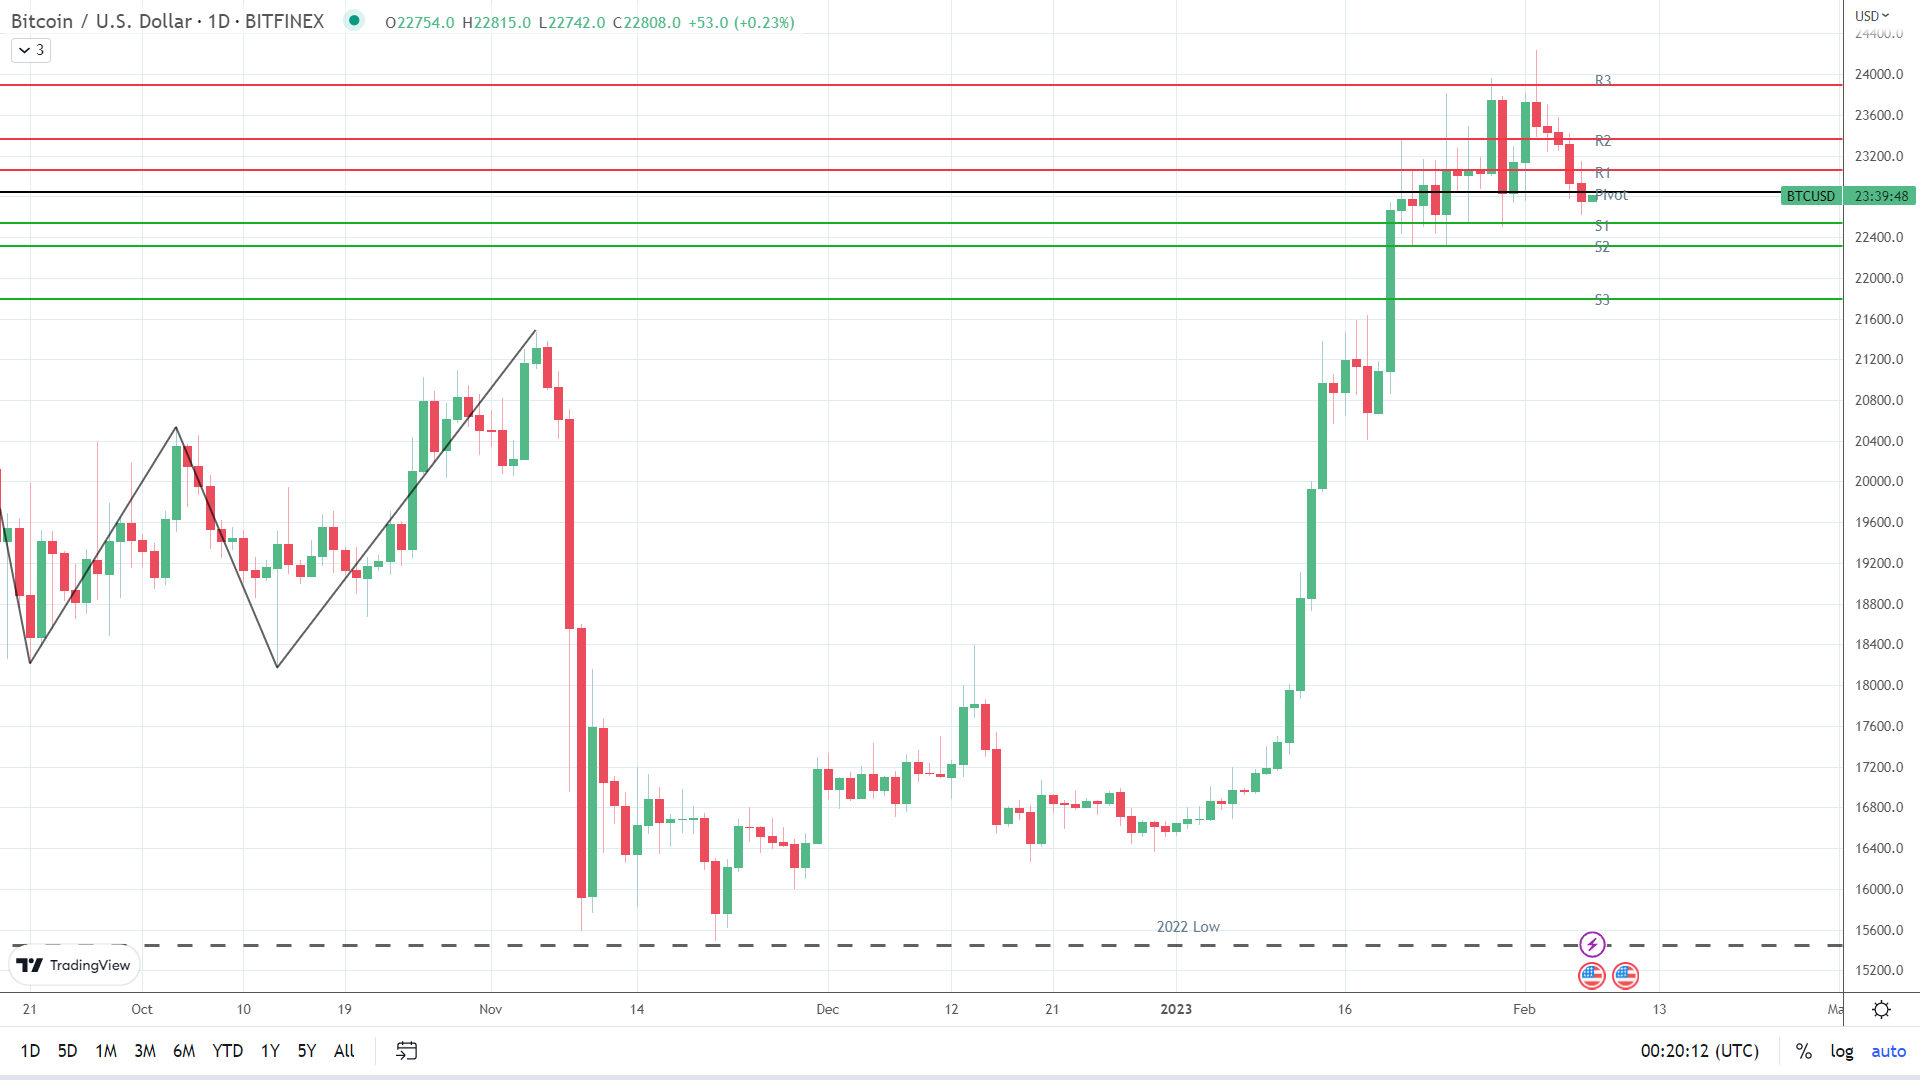
On Monday, bitcoin (BTC) fell by 0.77%. Following a 1.64% loss on Sunday, BTC ended the day at $22,755. BTC extended its losing streak to five sessions and ended the day at sub-$23,000 for the second time in six sessions.
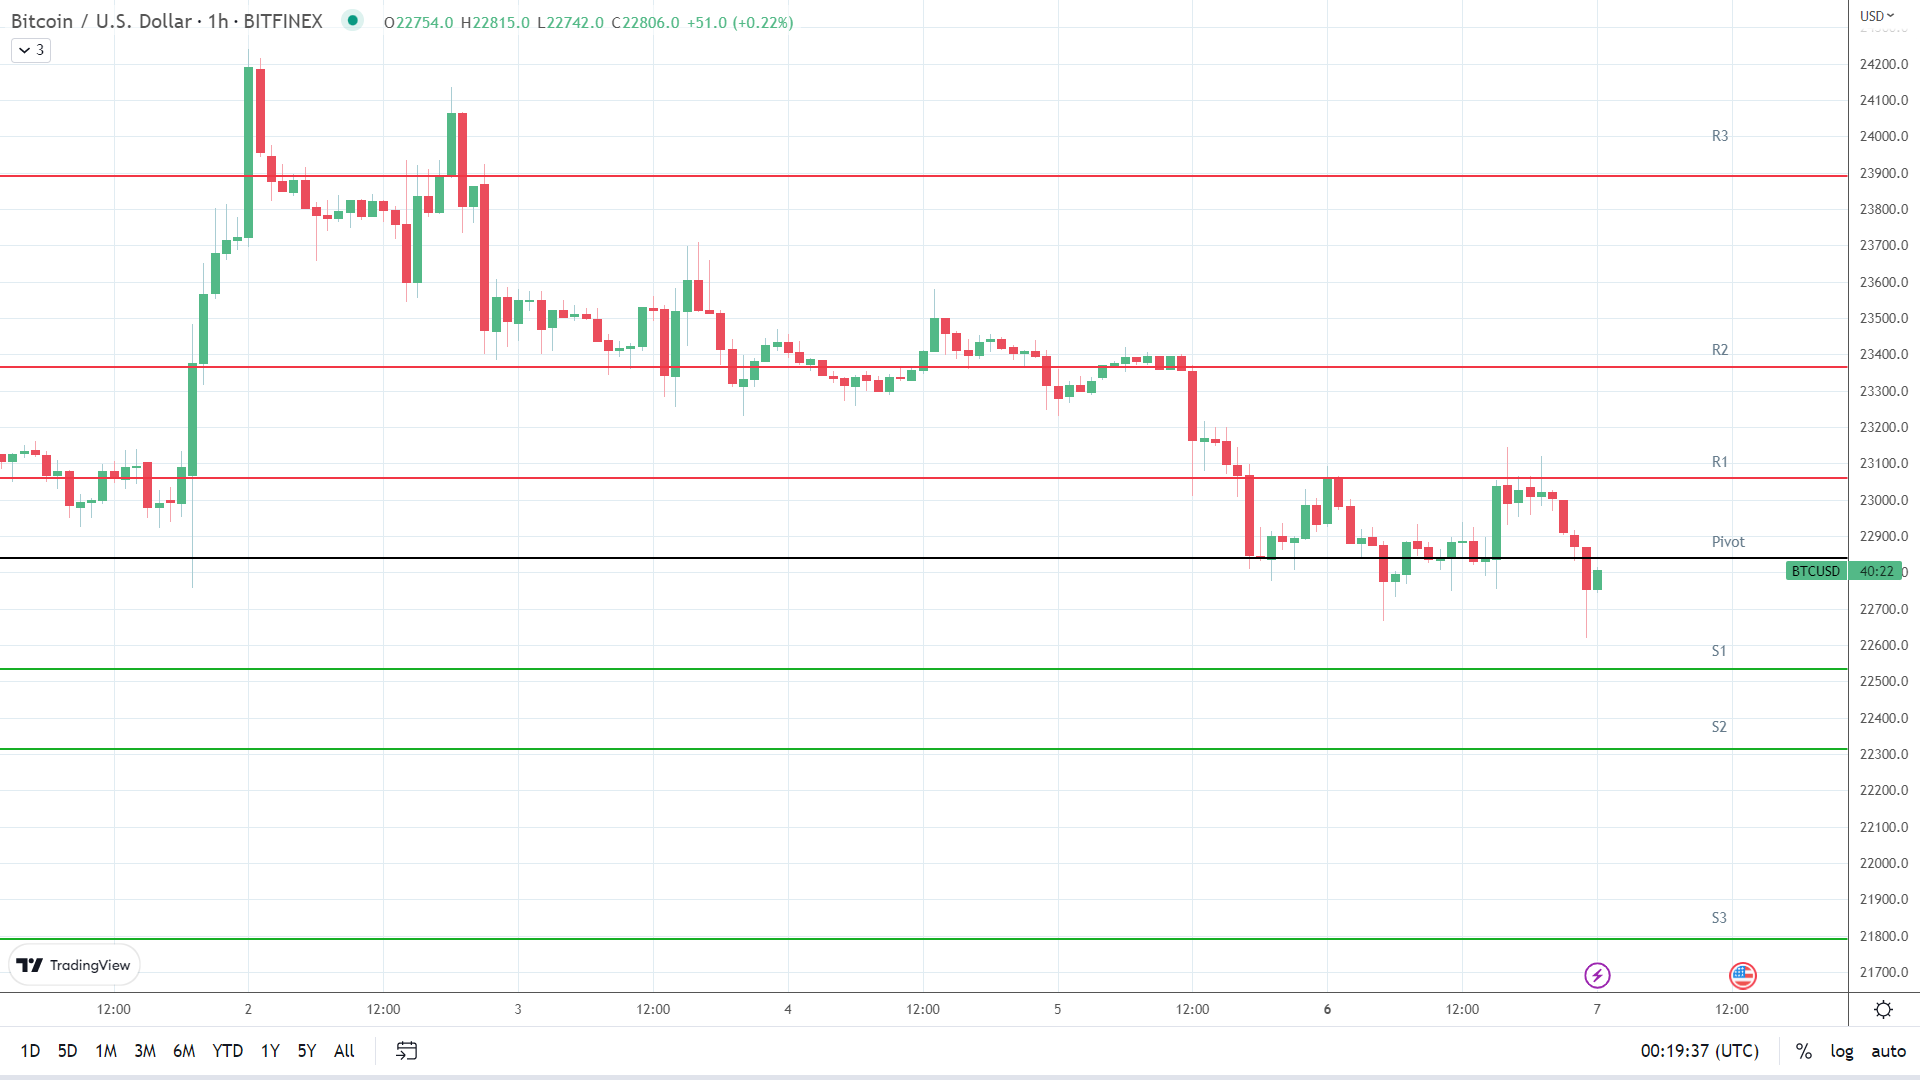
After a choppy morning, BTC rose to a late afternoon high of $23,145. Coming up short of the First Major Resistance Level (R1) at $23,308, BTC fell to a final-hour low of $22,620. However, finding support at the First Major Support Level (S1) at $22,666, BTC ended the day at $22,755.
Binance Dollar Suspensions and Fed Fear Leave BTC in the Red
It was a busier Monday session for the crypto market. Genesis contagion risk eased on news of Genesis creditors expecting at least 80 cents on the dollar through a proposed restructuring plan.
On Monday, Genesis announced it reached an agreement where Digital Currency Group (DCG) would exchange its existing $1.1 billion note for convertible preferred stock. DCG would also finance its existing term loans into two tranches payable to creditors. Additionally, DCG would contribute its equity interest in Genesis Global Trading (GGT) to Genesis Global Holdco to bring all Genesis entities under one hold co.
While the Genesis news was positive, news of Binance suspending US Dollar withdrawals starting February 8 spooked investors. However, the suspension does not affect Binance US users, leaving a reported 0.01% of active users affected by the dollar withdrawal suspension.
Fed Fear contributed to the bearish session, as riskier assets continued struggling because of the US Jobs Report. On Monday, the NASDAQ Composite Index fell by 1.0%. However, the NASDAQ mini was 27.75 points this morning, recovering from an early slide.
Today, investors need to monitor FOMC member chatter, with hawkish commentary likely to weigh on investor sentiment. However, there are no US stats to consider. The crypto news wires will need consideration, with FTX, Genesis, Silvergate Bank, and regulatory chatter remaining focal points.
The Fear & Greed Index Returns to Neutral on a Bearish BTC
Today, the BTC Fear & Greed Index returned to the Neutral zone, falling from 56/100 to 54/100. A five-day BTC losing streak led to a deterioration in investor sentiment, with Fed Fear pressuring BTC.
After returning to the Neutral zone, the Index must avoid the Fear zone to support a BTC return to $24,000. A fall into the Fear zone would signal a near-term bullish trend reversal.
Bitcoin (BTC) Price Action
At the time of writing, BTC was up 0.23% to $22,808. A mixed start to the day saw BTC fall to an early low of $22,742 before rising to a high of $22,815.
Technical Indicators
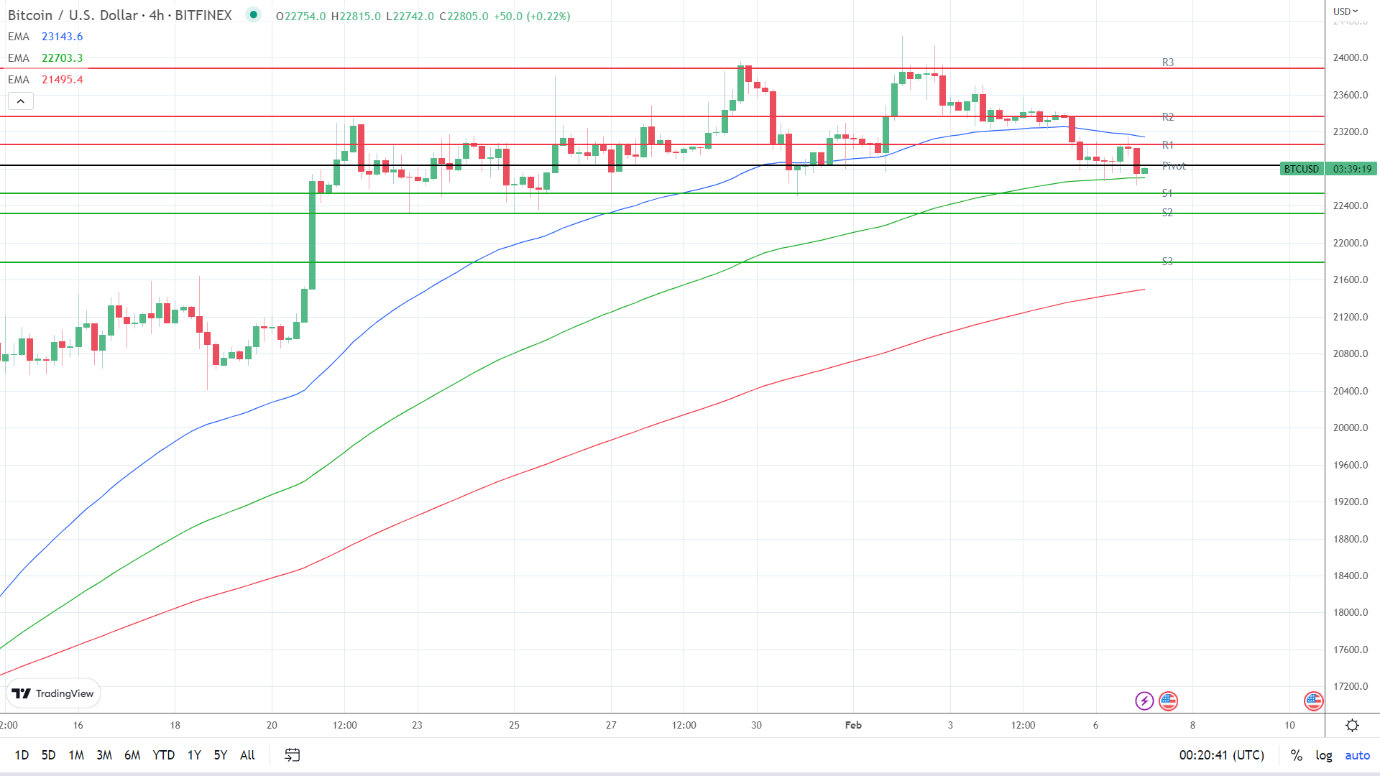
BTC needs to move through the $22,840 pivot to target the First Major Resistance Level (R1) at $23,060 and the Monday high of $23,145. A return to $23,000 would signal a breakout session. However, the crypto news wires will need to be crypto-friendly to support an extended rally.
In the event of an extended rally, BTC would likely test the Second Major Resistance Level (R2) at $23,365 and resistance at $23,500. The Third Major Resistance Level sits at $23,890.
Failure to move through the pivot would leave the First Major Support Level (S1) at $22,535 in play. However, barring a risk-off-fueled crypto sell-off, BTC should avoid sub-$22,000. The Second Major Support Level (S2) at $22,315 should limit the downside. The Third Major Support Level (S3) sits at $21,790.
Looking at the EMAs and the 4-hourly candlestick chart (below), it was a mixed signal. BTC sat above the 100-day EMA ($22,703). The 50-day EMA narrowed to the 100-day EMA, while the 100-day EMA widened from the 200-day EMA, delivering mixed signals.
A move through R1 ($23,060) and the 50-day EMA ($23,144) would support a run at R2 ($23,365) and $23,500. However, a fall through the 100-day EMA ($22,703) would bring S1 ($22,535) into view. A move through the 50-day EMA would send a bullish signal.
About the Author
Bob Masonauthor
With over 20 years of experience in the finance industry, Bob has been managing regional teams across Europe and Asia and focusing on analytics across both corporate and financial institutions. Currently he is covering developments relating to the financial markets, including currencies, commodities, alternative asset classes, and global equities.
Did you find this article useful?
Latest news and analysis


Advertisement