
Advertisement
Advertisement
BTC Fear & Greed Index Signals a BTC Return to $25,000
By:
Following a return to $23,000 on Wednesday, BTC was back on the move this morning. However, US economic indicators will influence in the afternoon.

In this article:
Key Insights:
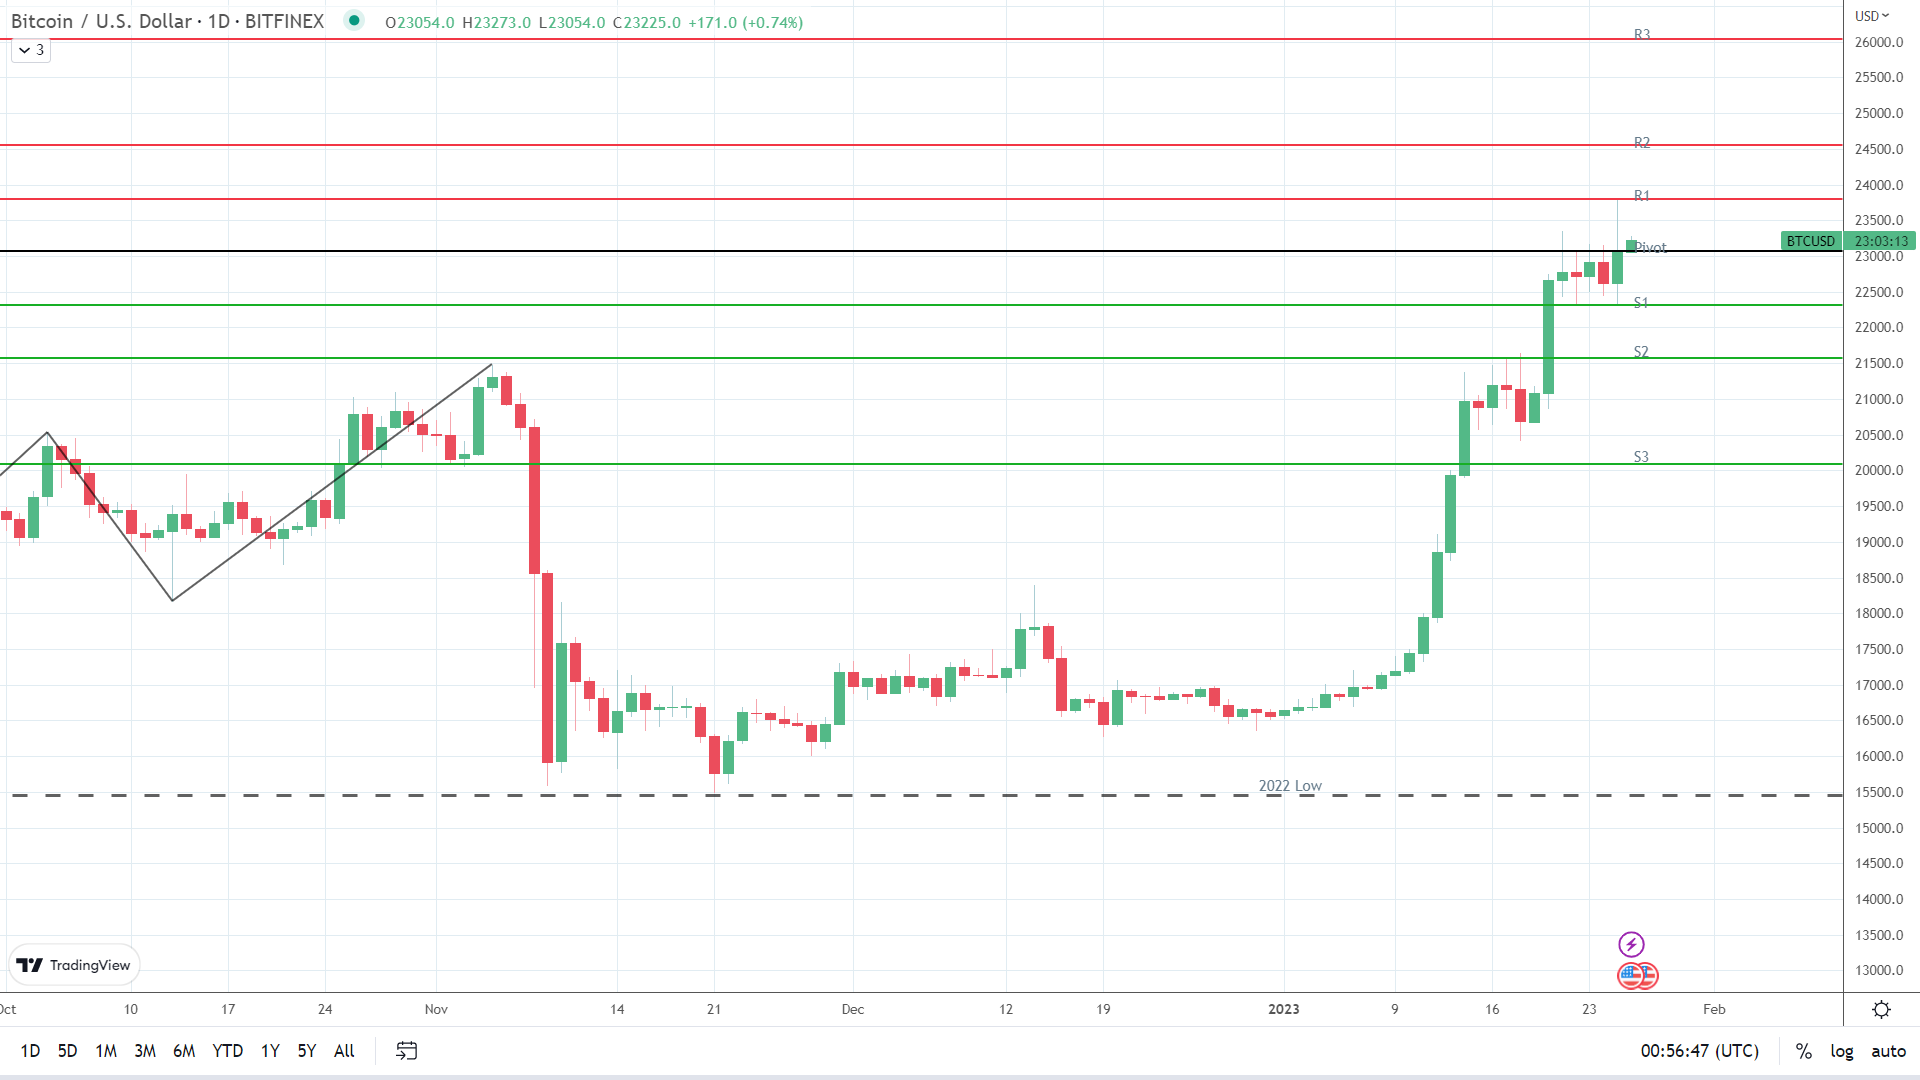
- It was a bullish Wednesday, with BTC wrapping up the session at $23,000 for the first time since August 18.
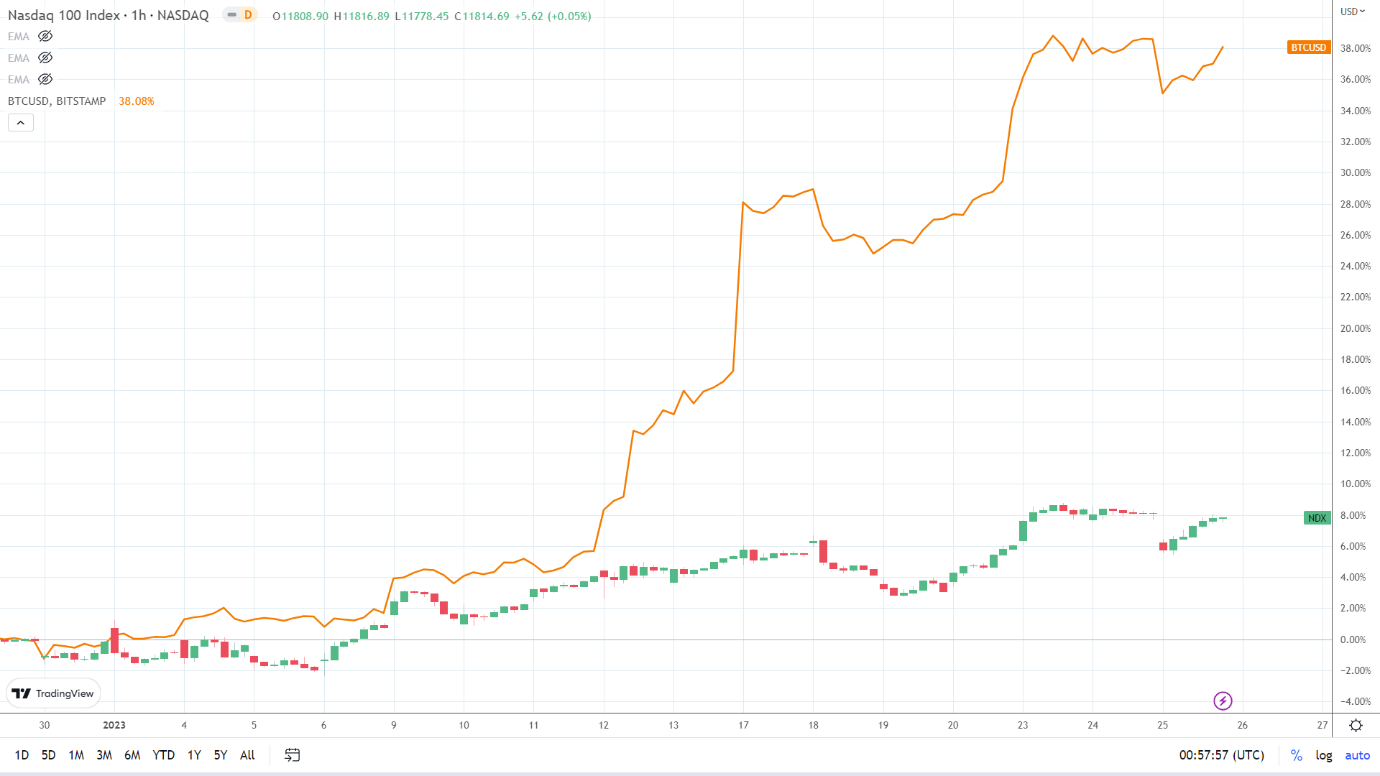
- BTC and the broader crypto market decoupled from the NASDAQ Index. Easing FTX and Gemini contagion risk delivered support.
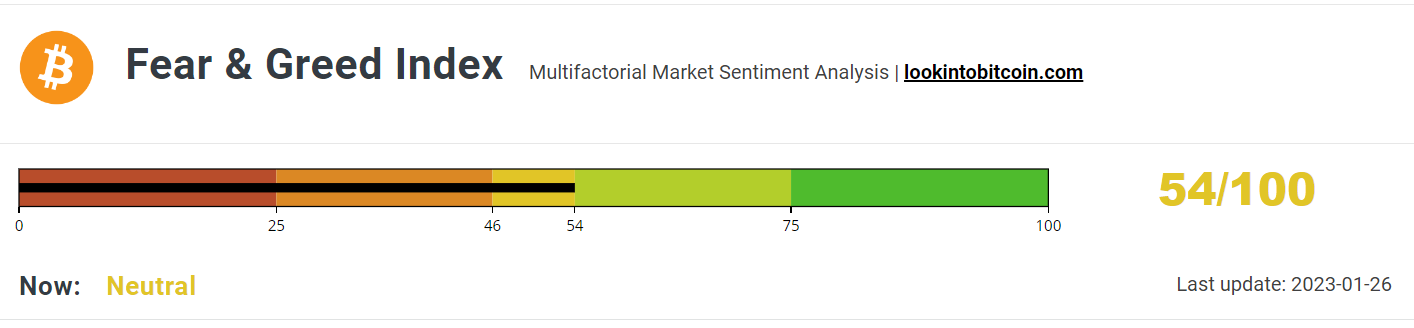
- The Fear & Greed Index rose from 51/100 to 54/100 but remained within the neutral zone.
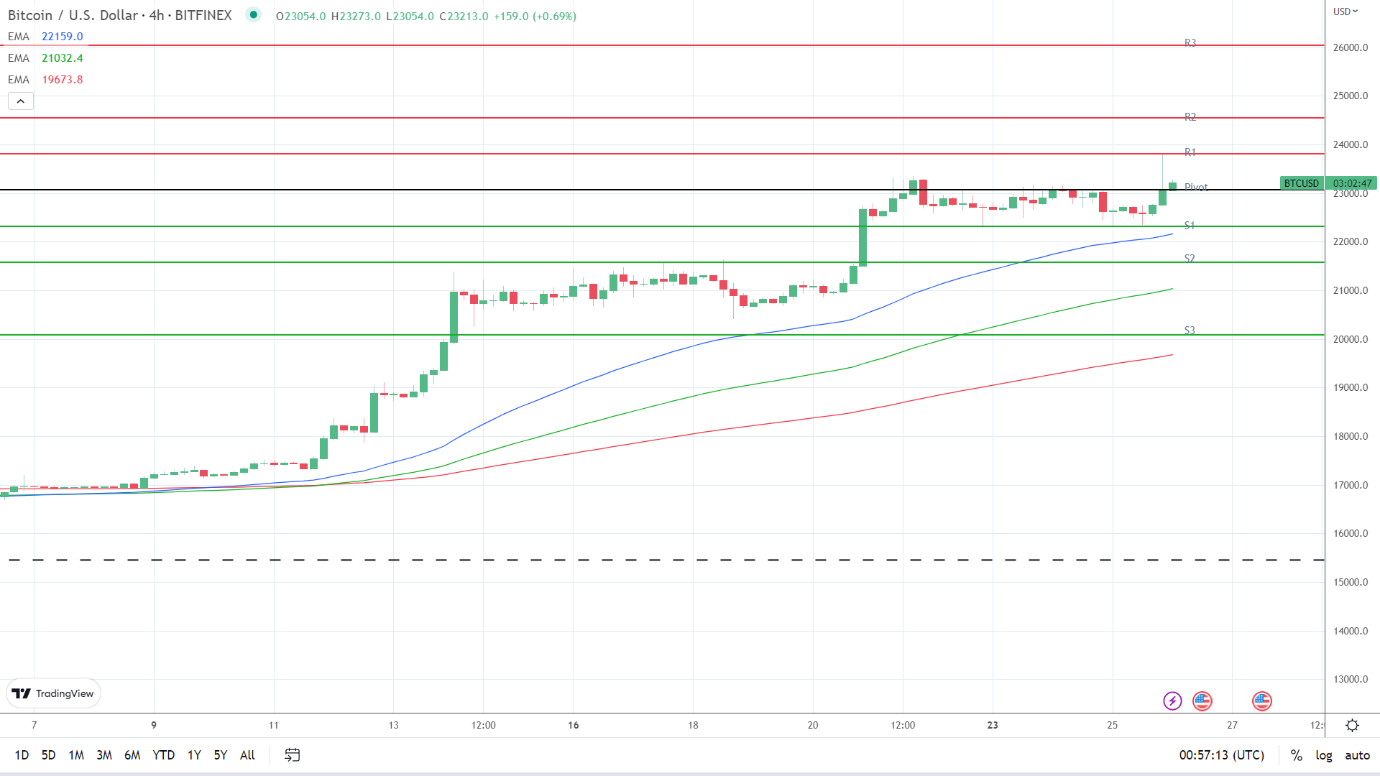
On Wednesday, bitcoin (BTC) rose by 1.89%. Reversing a 1.24% decline from Tuesday, BTC ended the day at $23,054. Notably, BTC held onto the $23,000 handle for the first time since August 18.
A bearish start to the day saw BTC fall to an early low of $22,324. Finding support at the First Major Support Level (S1) at $22,325, BTC rallied to a late high of $23,812. BTC broke through the First Major Resistance Level (R1) at $23,042 and briefly through the Second Major Resistance Level (R2) at $23,456 before easing back to end the day at $23,054.
Easing Contagion Risk Delivers a BTC Run at $24,000
It was a quiet day on the US economic calendar, with no US economic indicators to provide direction. US corporate earnings also failed to move the dial. Disappointing US corporate earnings were a drag on the NASDAQ Index, which declined by 0.18%. Gloomy forward guidance fueled recession fears to leave the NASDAQ in the red.
However, easing contagion risk supported BTC and the broader crypto market. Hopes of an FTX revival and the prospects of a painless Genesis bankruptcy continued to drive demand for crypto assets.
A Goldman Sachs (GS) report ranking BTC as the world’s best-performing asset also did its rounds, supporting the bullish session. On a total return basis, BTC outmuscled the MSCI Emerging Markets Index and asset classes, including gold, 10-year US Treasuries, and the NASDAQ Index.
Today, Genesis and FTX will remain in the spotlight. However, US economic indicators will also draw interest, with US GDP and jobless claims likely to affect sentiment toward the US economic outlook and Fed monetary policy.
The Fear & Greed Index Remains Neutral Despite a Bullish BTC
Today, the BTC Fear & Greed Index rose from 51/100 to 54/100. Despite the increase, the Index remained within the Neutral zone. However, the Index sits on the border with the Greed zone, signaling further BTC gains.
BTC held onto the $23,000 handle on Wednesday, supporting the move toward the Greed zone as investors responded to easing FTX and Genesis contagion risk.
However, uncertainty toward the US economic outlook, Fed monetary policy, and the regulatory environment has pegged the Index back.
Near-term, the Index would need to return to the Greed zone (55/100) to support a BTC run at $25,000. The Index last visited the Greed zone in March 2022.
Bitcoin (BTC) Price Action
At the time of writing, BTC was up 0.74% to $23,225. A bullish start to the day saw BTC rise from an early low of $23,054 to a high of $23,273.
Technical Indicators
BTC needs to avoid a fall through the $23,063 pivot to target the First Major Resistance Level (R1) at $23,803 and the Wednesday high of $23,812. A return to $23,500 would support a bullish session. However, the crypto news wires and US economic indicators should be market-friendly to deliver a breakout.
In the event of another extended rally, BTC would likely test the Second Major Resistance Level (R2) at $24,551 and resistance at $25,000. The Third Major Resistance Level (R3) sits at $26,039.
A fall through the pivot would bring the First Major Support Level (S1) at $22,315 into play. Barring a broad-based crypto sell-off, BTC should avoid sub-$22,000 and the Second Major Support Level (S2) at $21,575. The Third Major Support Level (S3) sits at $20,087.
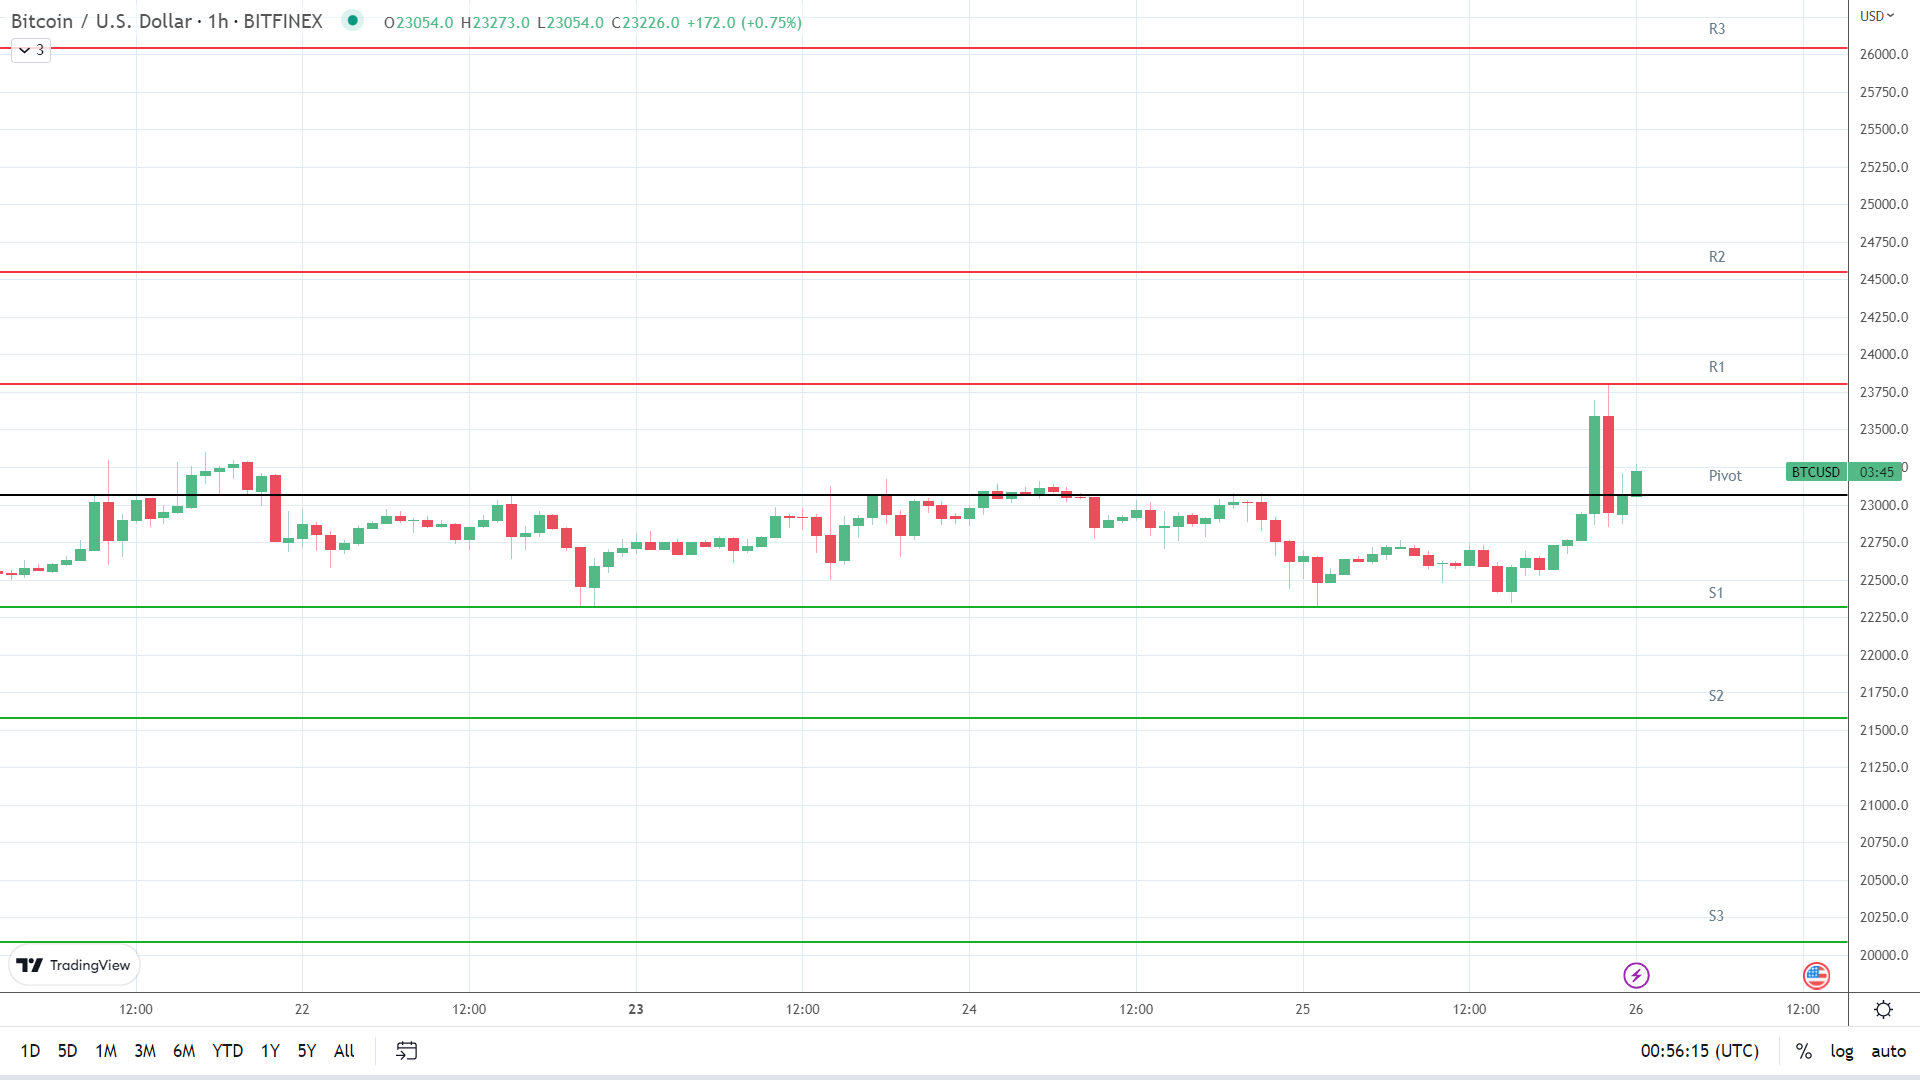
Looking at the EMAs and the 4-hourly candlestick chart (below), it was a bullish signal. BTC sat above the 50-day EMA, currently at $22,159. The 50-day EMA pulled further away from the 200-day EMA, with the 100-day EMA widening from the 200-day EMA, delivering bullish signals.
A hold above S1 ($22,315) and the 50-day EMA ($22,159) would support a breakout from R1 ($23,803) to target R2 ($24,551) and $25,000. However, a fall through S1 ($22,315) and the 50-day EMA ($22,159) would give the bears a run at S2 ($21,575). A fall through the 50-day EMA would signal a shift in sentiment.
About the Author
Bob Masonauthor
With over 20 years of experience in the finance industry, Bob has been managing regional teams across Europe and Asia and focusing on analytics across both corporate and financial institutions. Currently he is covering developments relating to the financial markets, including currencies, commodities, alternative asset classes, and global equities.
Did you find this article useful?
Latest news and analysis


Advertisement