
Advertisement
Advertisement
BTC Fear & Greed Index Slides Ahead of the US Jobs Report
By:
Following a mixed Thursday session, BTC and the NASDAQ Index will face another stern test, with the US jobs report to decide the Fed's February move.

In this article:
Key Insights:
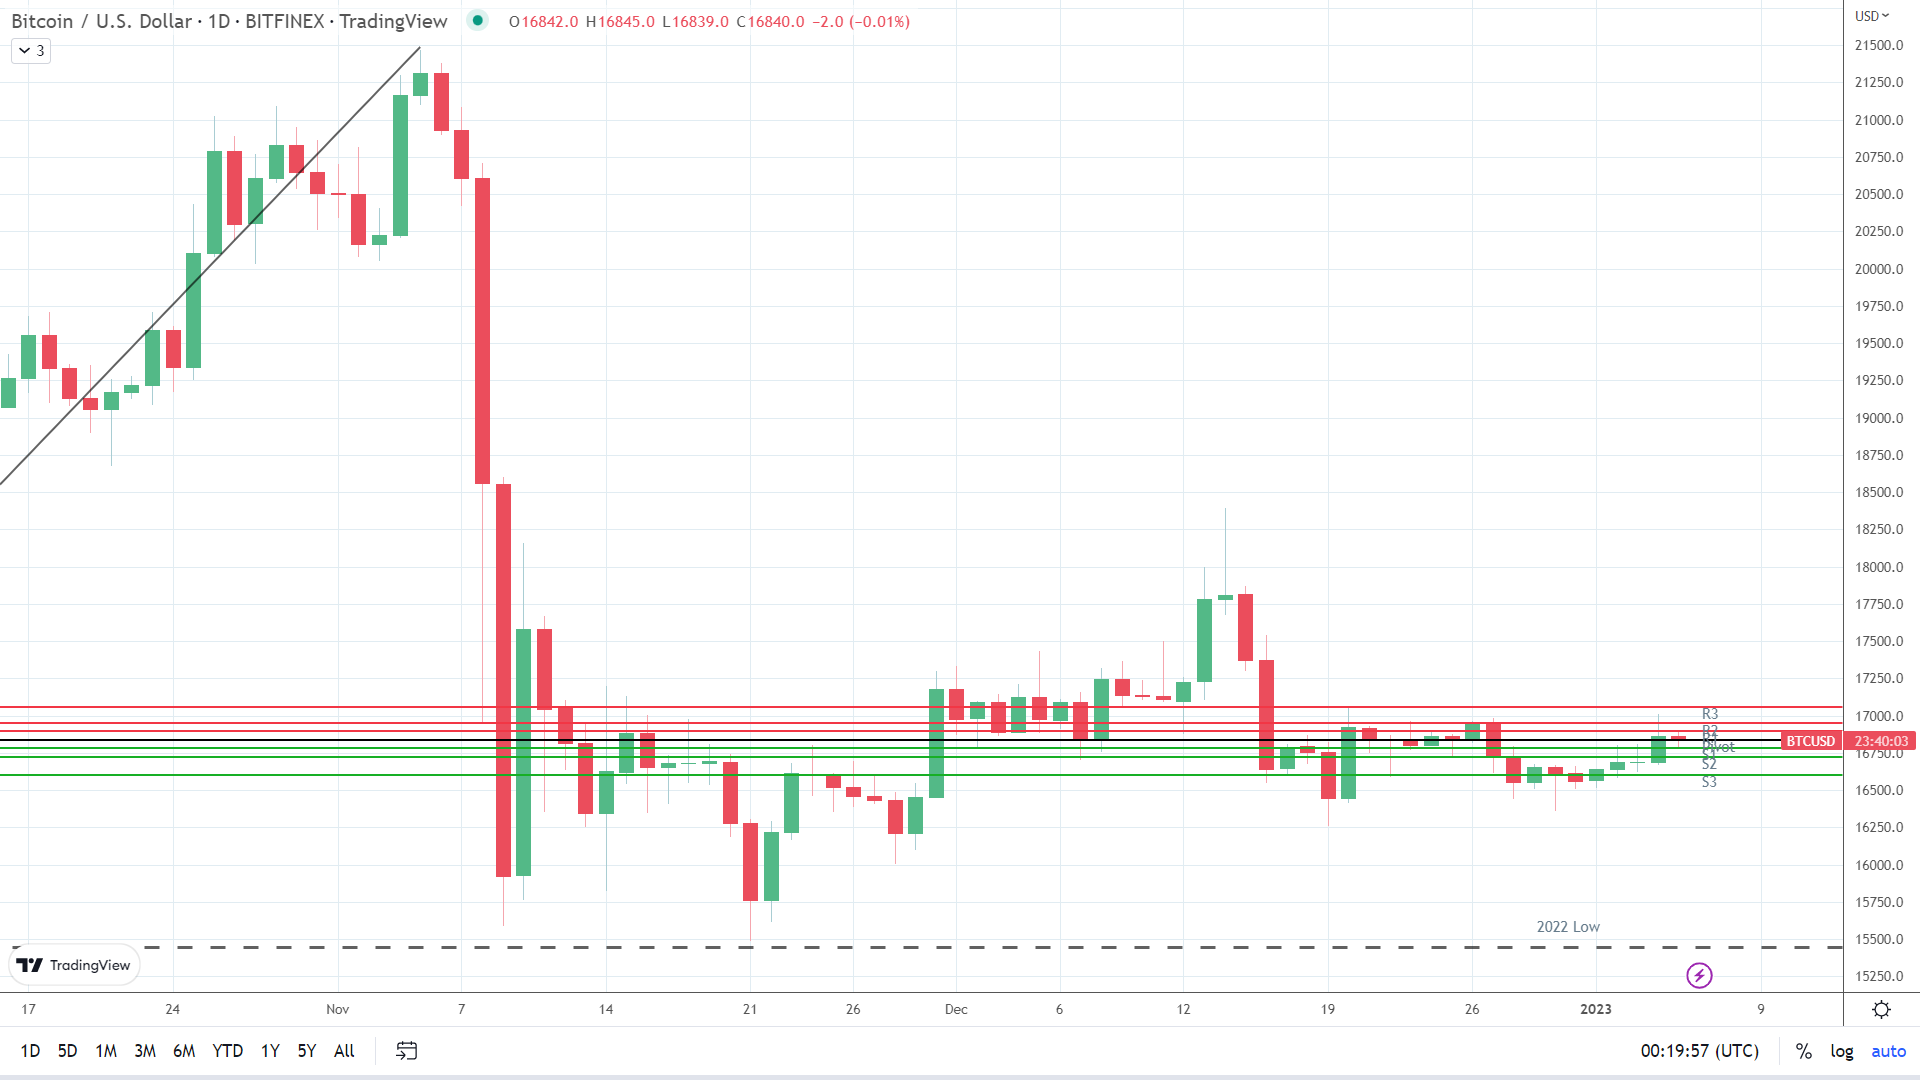
- It was a bearish Thursday, with BTC falling by 0.13% to end the day at $16,842.
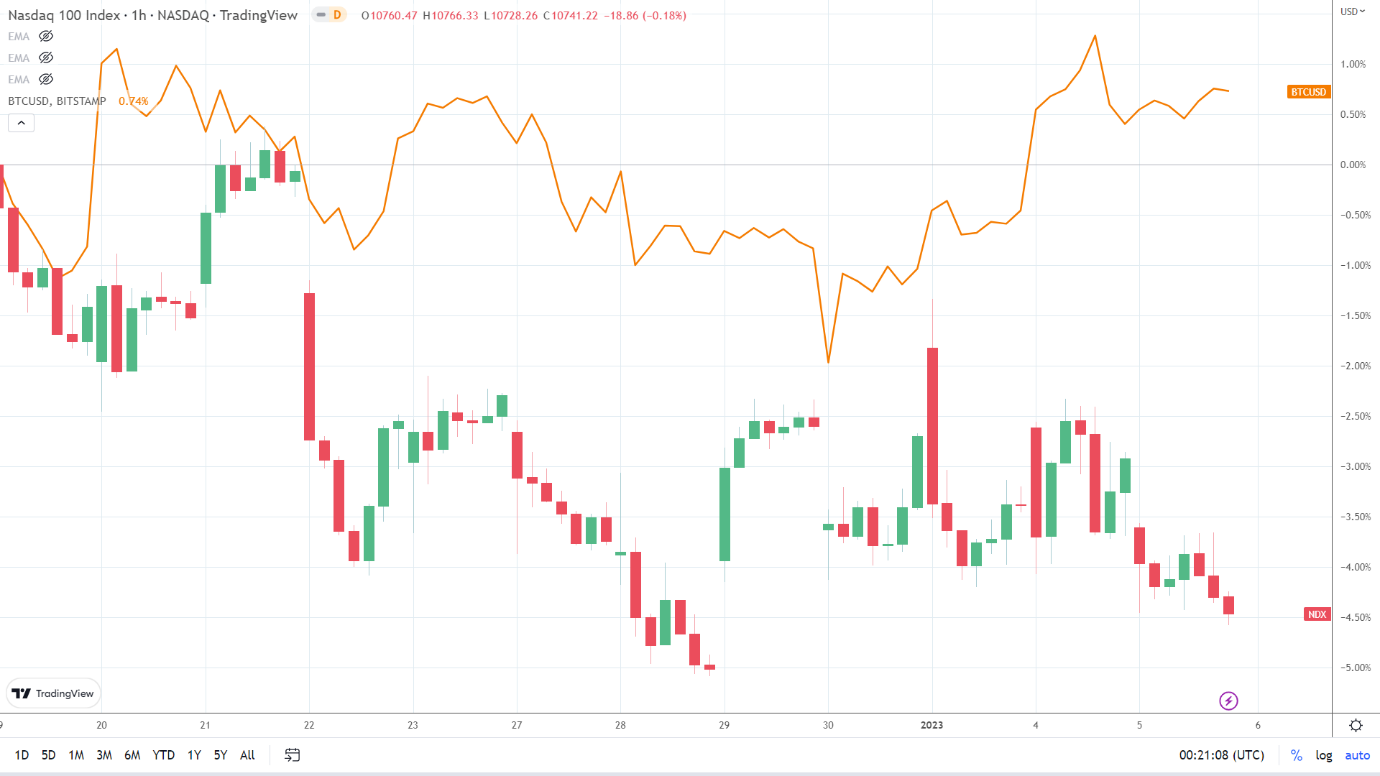
- US economic indicators sent the NASDAQ Index and BTC into the red.
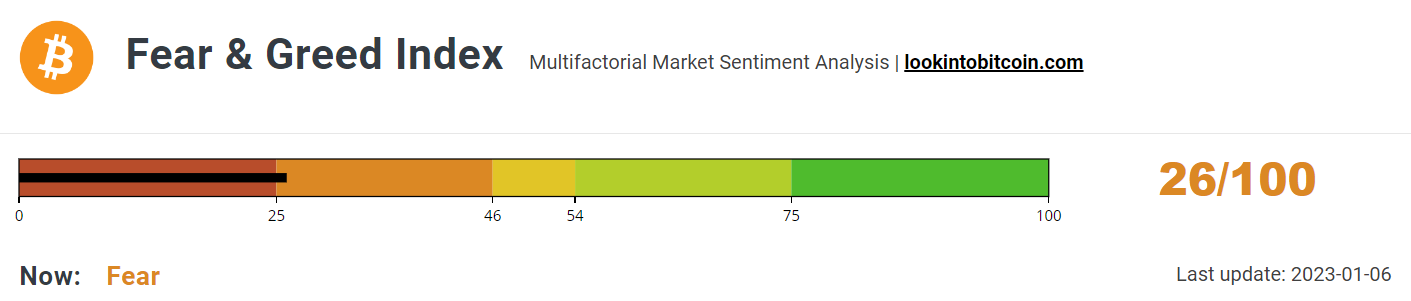
- The Fear & Greed Index fell from 29/100 to 26/100, signaling a bearish session ahead.
On Thursday, bitcoin (BTC) slipped by 0.13%. Following a 1.05% gain on Wednesday, BTC ended the day at $16,842. BTC fell short of $17,000 while avoiding sub-$16,500 for the sixth consecutive session.
A mixed start to the day saw BTC rise to an early high of $16,888. Coming up short of the First Major Resistance Level (R1) at $17,024, BTC fell to an early afternoon low of $16,775. However, steering clear of the First Major Support Level (S1) at $16,688, BTC rose to a late high of $16,885 before falling back into the red.
US Economic Indicators Reignite Fed Fear to Send BTC into the Red
It was a busy Thursday, with the US economy in the spotlight. Labor market economic indicators beat forecasts, supporting the hawkish FOMC meeting minutes.
In December, the ADP reported a 235k increase in nonfarm payrolls versus a forecasted 150k rise. Nonfarm payrolls increased by 182k in November, according to the ADP.
The weekly jobless claim numbers added to the bearish mood, with initial jobless claims falling from 223k to 204k, its lowest level since September. For the Fed doves, the latest stats remove any chance of a Fed pivot, with the strong labor market conditions giving plenty of wriggle room to bring inflation to target.
The NASDAQ Index and the S&P 500 fell by 1.47% and 1.16%, respectively, in response to more hawkish Fed bets.
Today, the market focus will be on the US jobs report. Expect plenty of market volatility, with the jobs report likely to define the Fed’s February policy move.
A better-than-expected increase in nonfarm payrolls and a steady or lower unemployment rate would send riskier assets and the broader crypto market into the red.
Later in the US session, ISM Non-Manufacturing PMI numbers will also be in focus. The headline and sub-components, including employment and non-manufacturing prices, will influence.
The NASDAQ mini was up 22.5 points this morning.
The Fear & Greed Index Slides Ahead of US Jobs Report
Today, the BTC Fear & Greed Index fell from 29/100 to 26/100.
Notably, the Index took a hit despite a modest BTC loss, reflecting investor sentiment toward the US labor market numbers and investor angst ahead of today’s jobs report.
However, the Index avoided a return to the Extreme Fear zone, signaling investor resilience to further hawkish Fed rate hikes.
Avoiding sub-20/100 remains the key near-term. The bulls will need to target the pre-FTX collapse November 6 high of 40/100 to support a BTC run at $20,000.
Bitcoin (BTC) Price Action
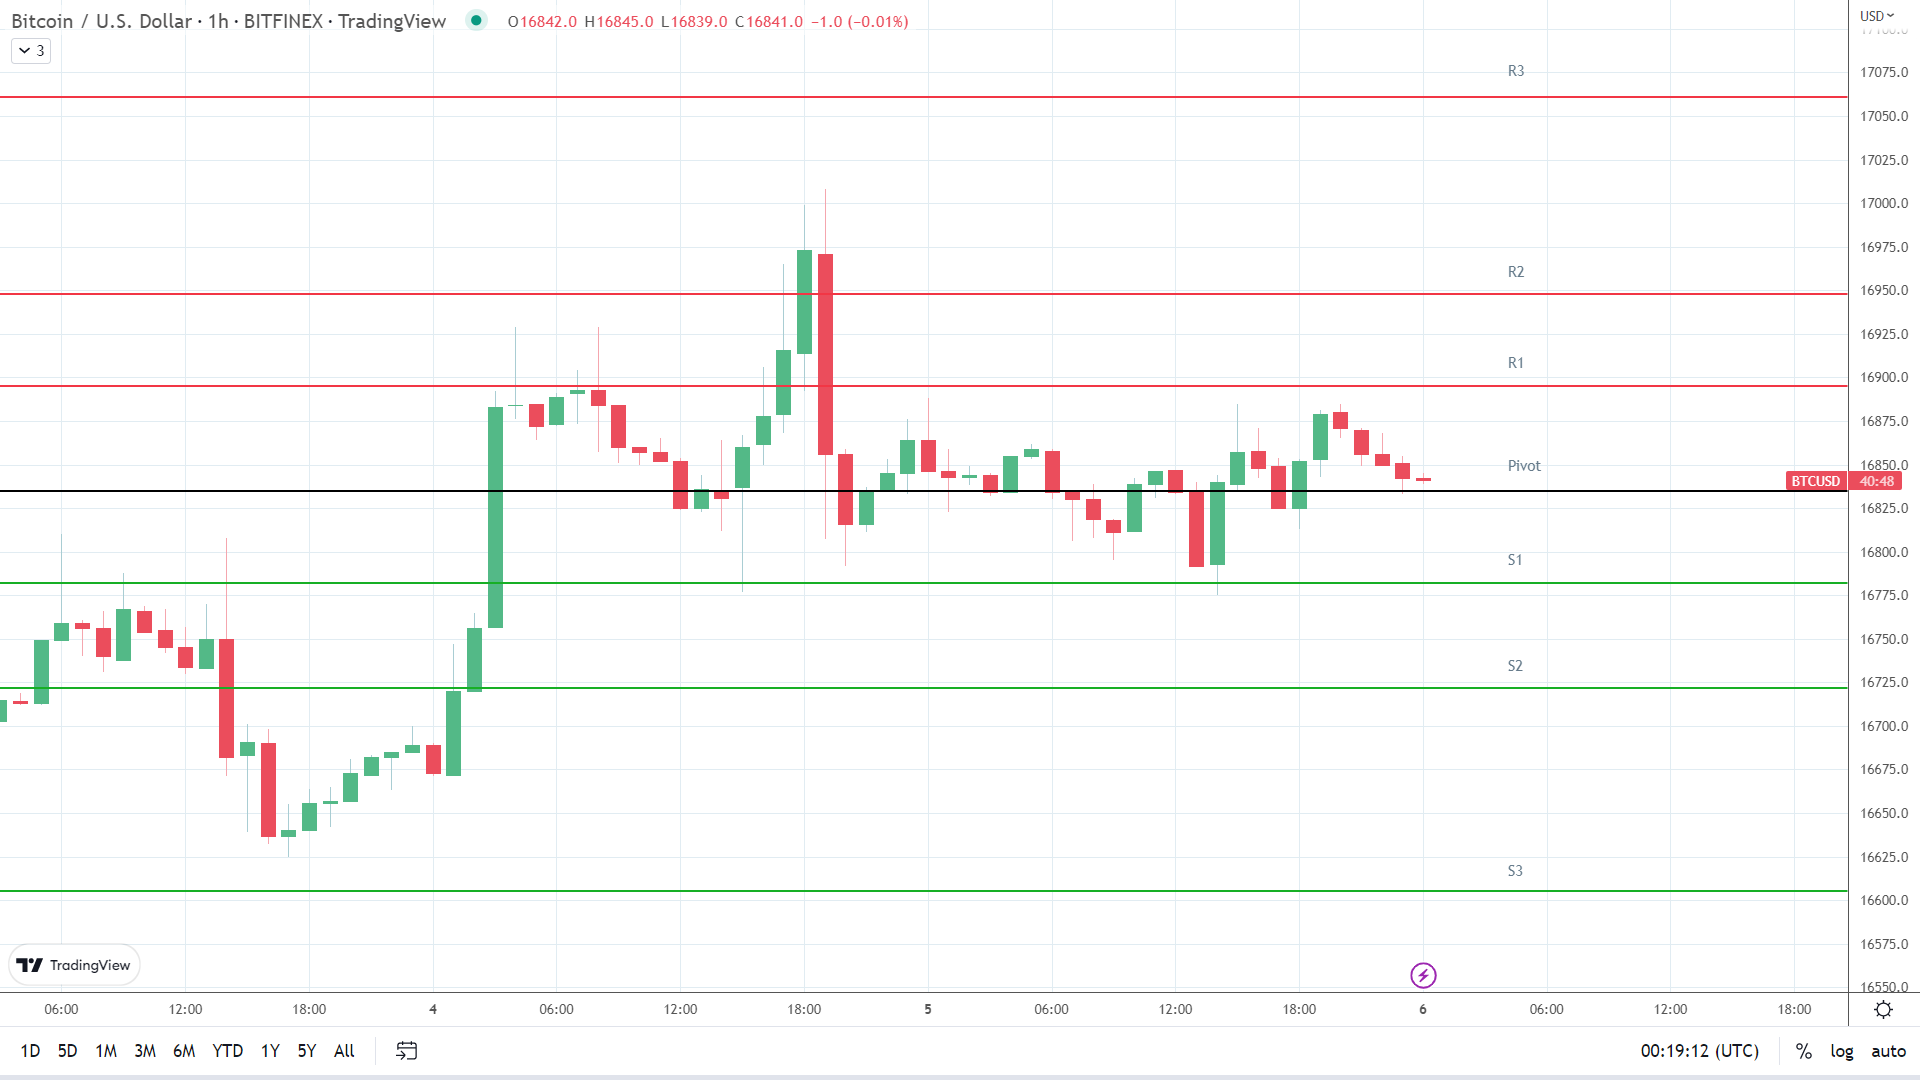
At the time of writing, BTC was down 0.01% to $16,840. A range-bound start to the day saw BTC fall to an early low of $16,839 before rising to a high of $16,845.
Technical Indicators
BTC needs to avoid a fall through the $16,835 pivot to target the First Major Resistance Level (R1) at $16,895. A return to $16,900 would signal a bullish session. However, the US stats need to be crypto-friendly to support a breakout session.
In the event of an extended rally, BTC would likely test the Second Major Resistance Level (R2) at $16,948 and resistance at $17,000. The Third Major Resistance Level (R3) sits at $17,061.
A fall through the pivot would bring the First Major Support Level (S1) at $16,782 into play. Barring a crypto risk-off-fueled sell-off, BTC should avoid sub-$16,700. The Second Major Support Level (S2) at $16,722 should limit the downside. The Third Major Support Level (S3) sits at $16,609.
An adverse crypto market event would bring sub-$16,000 into play.
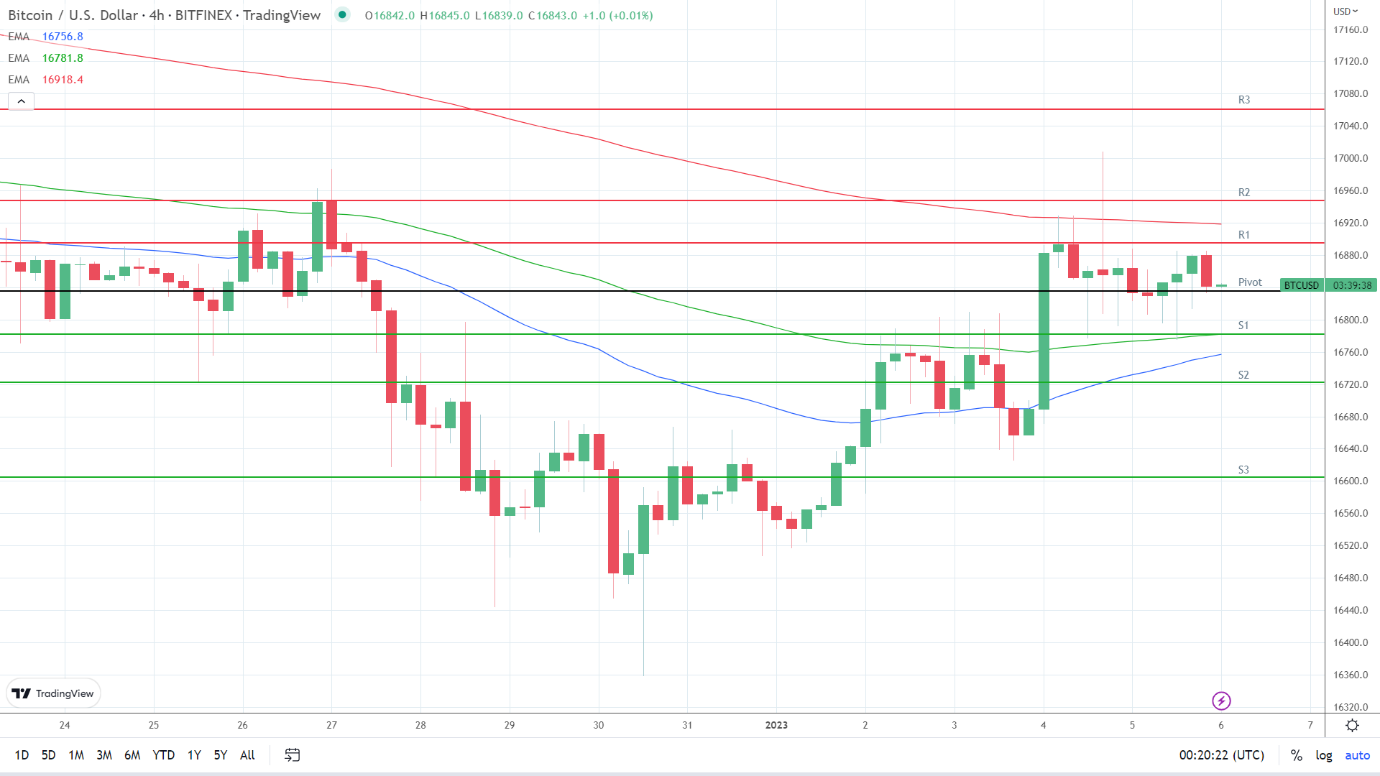
Looking at the EMAs and the 4-hourly candlestick chart (below), it was a more bullish signal. BTC sat above the 100-day EMA, currently at $16,782. The 50-day EMA closed in on the 100-day EMA, with the 100-day EMA narrowing to the 200-day EMA, delivering bullish signals.
A move through R1 ($16,895) and the 200-day EMA ($16,918) would support a breakout from R2 ($16,948) to target $17,000. However, a fall through the 100-day EMA ($16,782) and S1 ($16,782) would give the bears a run at the 50-day EMA ($16,757) and S2 ($16,722). A fall through the 50-day EMA would be a bearish signal.
About the Author
Bob Masonauthor
With over 20 years of experience in the finance industry, Bob has been managing regional teams across Europe and Asia and focusing on analytics across both corporate and financial institutions. Currently he is covering developments relating to the financial markets, including currencies, commodities, alternative asset classes, and global equities.
Did you find this article useful?
Latest news and analysis


Advertisement