Analysis

Ethereum Classic: After flipping a 14-month support, here’s what to look out for in ETC
Posted:

Disclaimer: The findings of the following analysis are the sole opinions of the writer and should not be considered investment advice.
Ethereum Classic (ETC) has been on a swift withdrawal phase after reversing from its year-long trendline resistance near the $52-mark. After puncturing through some vital price ranges, the altcoin flipped its 14-month support to resistance (white) amidst the market-wide sell-off.
The immediate support at the $17.5 did hold up the recent drop. Any close below this level could delay the revival that may be due for the alt in the coming sessions. AT press time, ETC traded at $18.42, down by 9.17% in the last 24 hours.
ETC 4-hour Chart
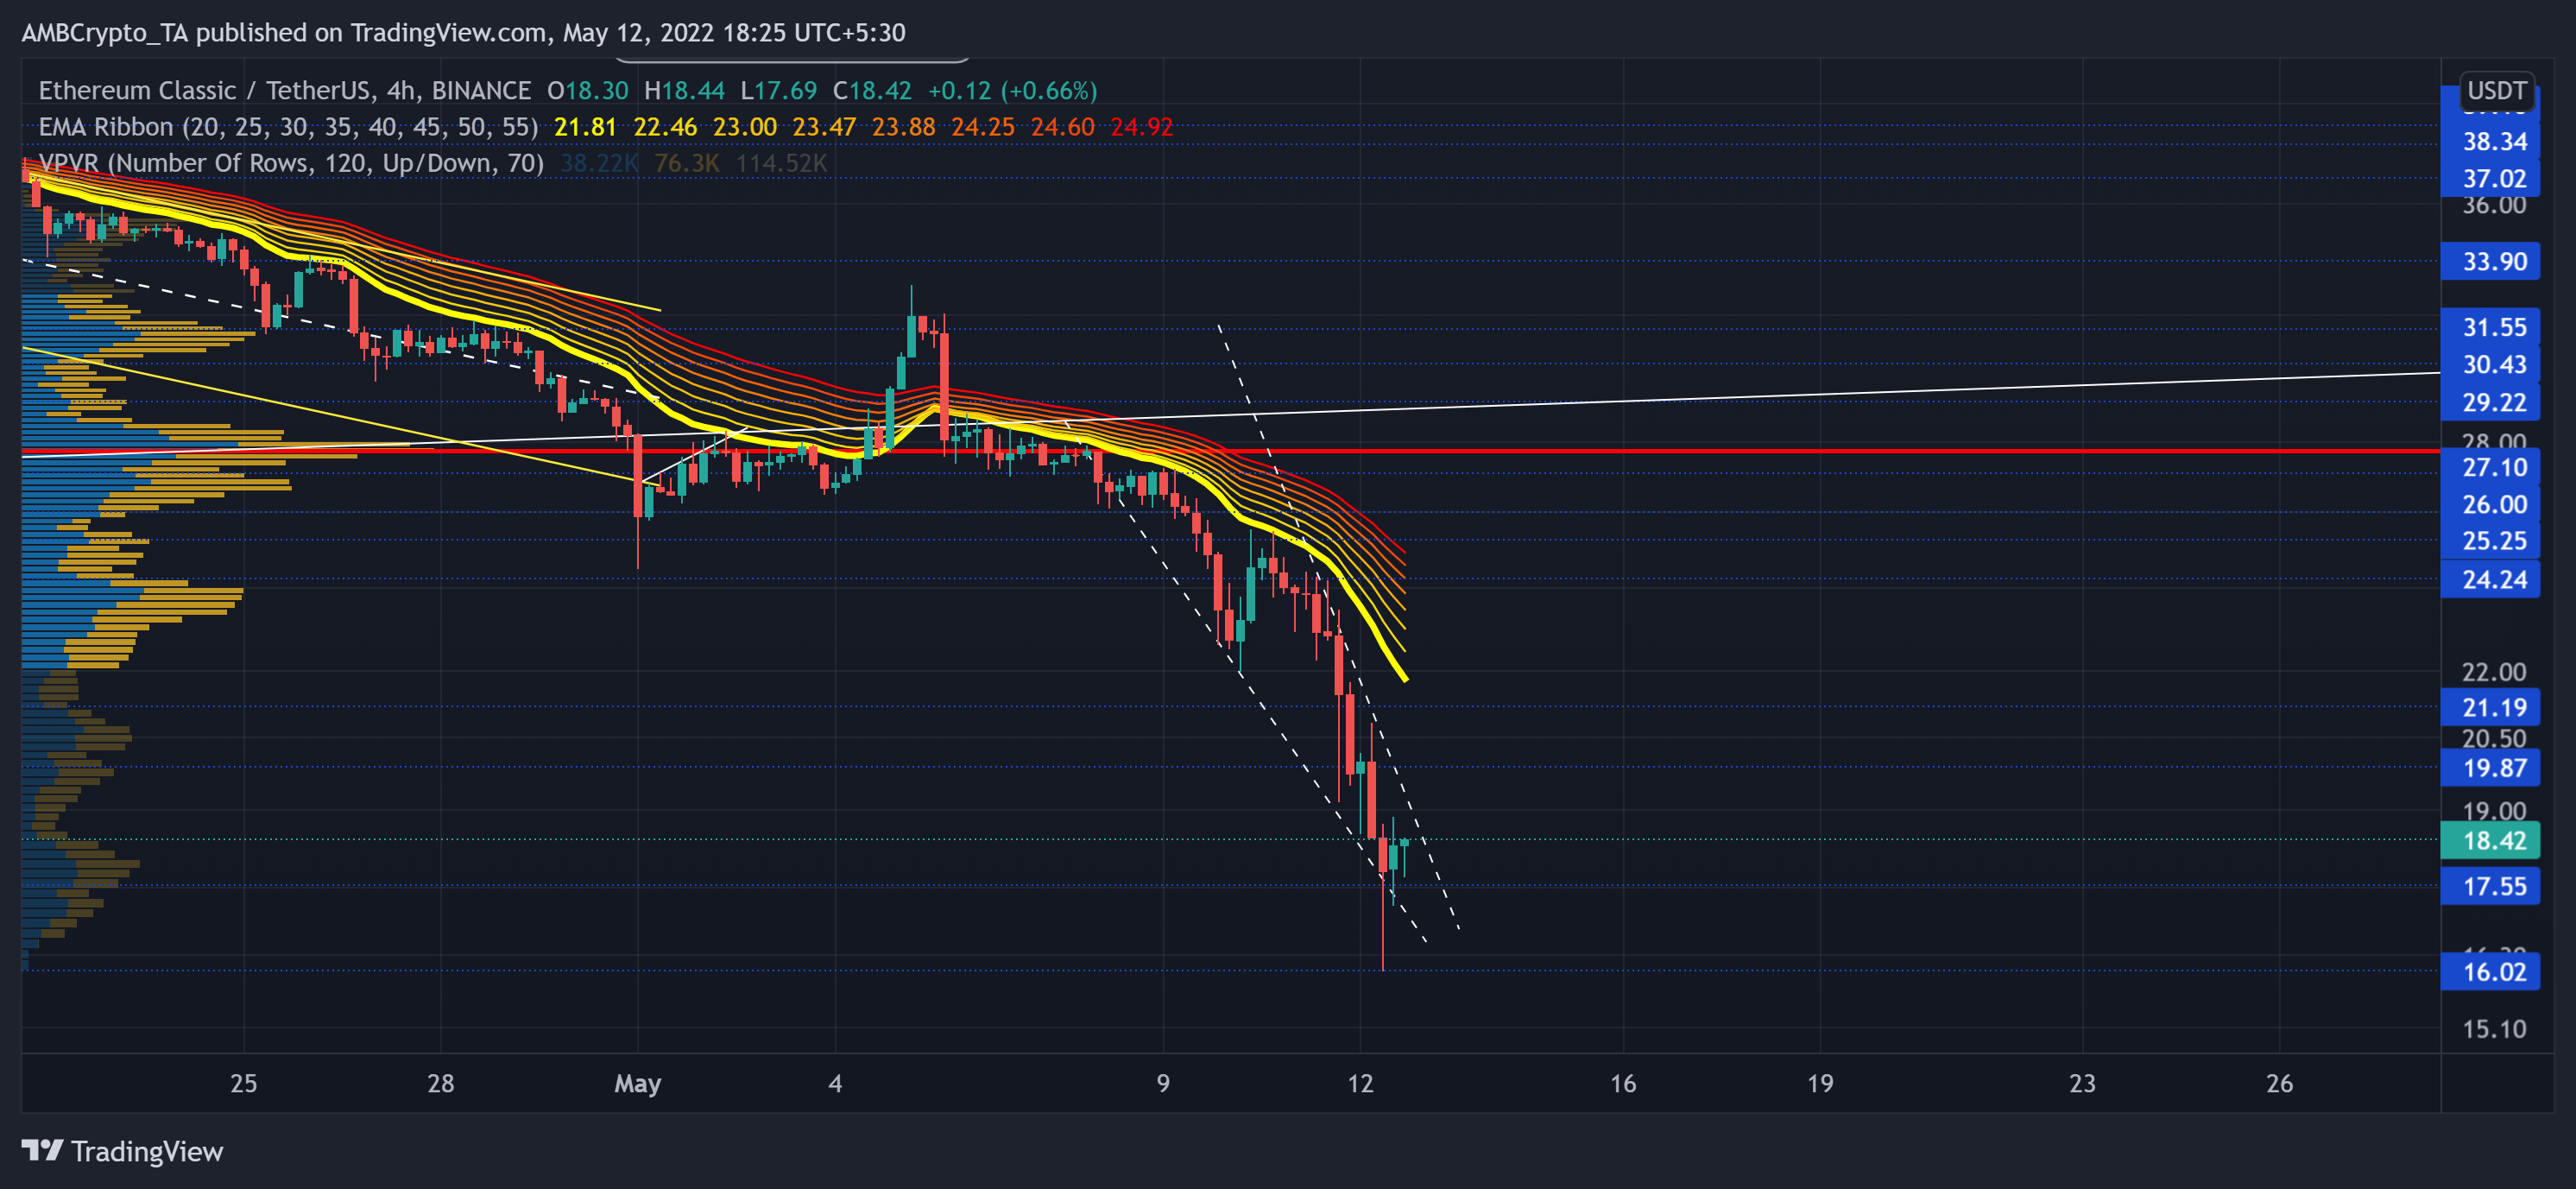
Source: TradingView, ETC/USDT
The falling wedge (white) decline saw a whopping 35.1% fall over the last four days. The selling spree momentarily ceased at the $17.5 baseline after the recent bullish hammer candlestick.
After briefly consolidating at its highest liquidity range (represented by the Point of Control [POC], red), the bears were quick to glide through the hurdles in the $21-$24 range. Also, the altcoin saw a sizeable uptick in its 24-hour trading volumes that revealed a strong bearish form.
With the EMA ribbons abstaining to look south, the gap between the ribbons is only growing wider to depict a strong selling edge. Considering the recent rejection of lower prices, ETC could hold the heightened sell-off situation.
In doing so, a lift-off from the immediate floor would open doorways to gain enough thrust to break the bonds of its falling wedge. However, the $19-$21 range would continue posing hurdles owing to the bearish market structure.
Rationale

Source: TradingView, ETC/USDT
The Relative Strength Index bounced back after approaching its long-term floor at the 17-level. But it still refused to recover from the oversold region. The 22-25 range would be critical for the buyers to topple, in order for them to hold their immediate grounds.
The Aroon up (yellow) has been struggling to find a sustainable rally beyond the 22.5%-mark for a week now. An inability to overturn this level could lead to an extended sluggish phase on the chart.
Conclusion
Post the recent rejection of lower prices after the bullish hammer, the buyers showed some conviction to hold immediate grounds. But a failure to amplify the buying volumes could result in an unwanted delay in a well-needed bullish revival beyond the falling wedge.
Besides, the broader market sentiment and the on-chain developments would play a vital role in influencing future movements.