
Advertisement
Advertisement
Ethereum, Litecoin, and Ripple’s XRP – Daily Tech Analysis – September 14th, 2021
By:
After Monday's losses, failure to move through the day's pivot levels would leave the majors under pressure.

Ethereum
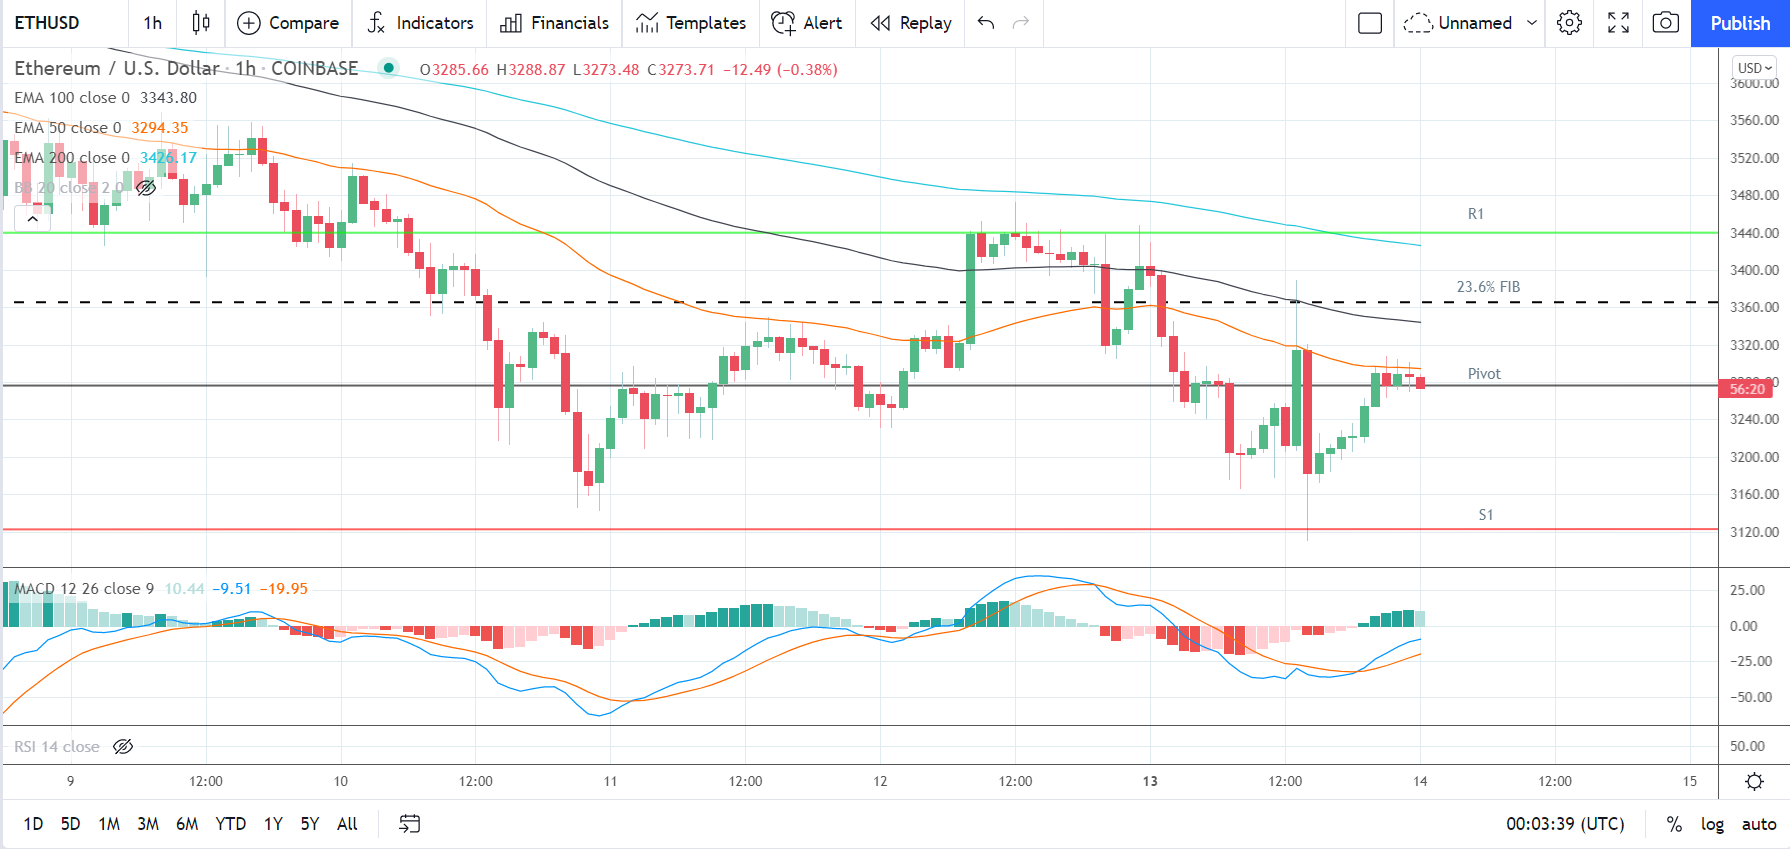
Ethereum fell by 3.46% on Monday. Partially reversing a 4.19% gain from Sunday, Ethereum ended the day at $3,286.20.
A mixed start to the day saw Ethereum rise to an early morning intraday high $3,430.00 before hitting reverse.
Falling short of the first major resistance level at $3,507, Ethereum slid to an early afternoon intraday low $3,111.14.
Ethereum fell through the first major support level at $3,266 and the second major support level at $3,128.
Ethereum also fell through the 23.6% FIB of $3,369. Finding late support, however Ethereum broke back through the major support levels to end the day at $3,280 levels.
At the time of writing, Ethereum was down by 0.38% to $3,273.71. A mixed start to the day saw Ethereum rise to an early morning high $3,288.87 before falling to a low $3,273.48.
Ethereum left the major support and resistance levels untested early on.
For the day ahead
Ethereum would need to move back through the $3,276 pivot to bring the first major resistance level at $3,440 into play.
Support from the broader market would be needed, however, for Ethereum to break out from the 23.6% FIB of $3,369.
Barring an extended crypto rally, the first major resistance level and Monday’s high $3,430.00 would likely cap the upside.
In the event of a broad-based crypto rally, Ethereum could test resistance at $3,700 before any pullback. The second major resistance level sits at $3,595.
Failure to move back through the $3,276 pivot would bring the first major support level at $3,122 into play.
Barring an extended sell-off, however, Ethereum should steer clear of sub-$3,000 levels. The second major support level sits at $2,957.
Looking at the Technical Indicators
First Major Support Level: $3,122
Pivot Level: $3,276
First Major Resistance Level: $3,440
23.6% FIB Retracement Level: $3,369
38.2% FIB Retracement Level: $2,740
62% FIB Retracement Level: $1,725
Litecoin
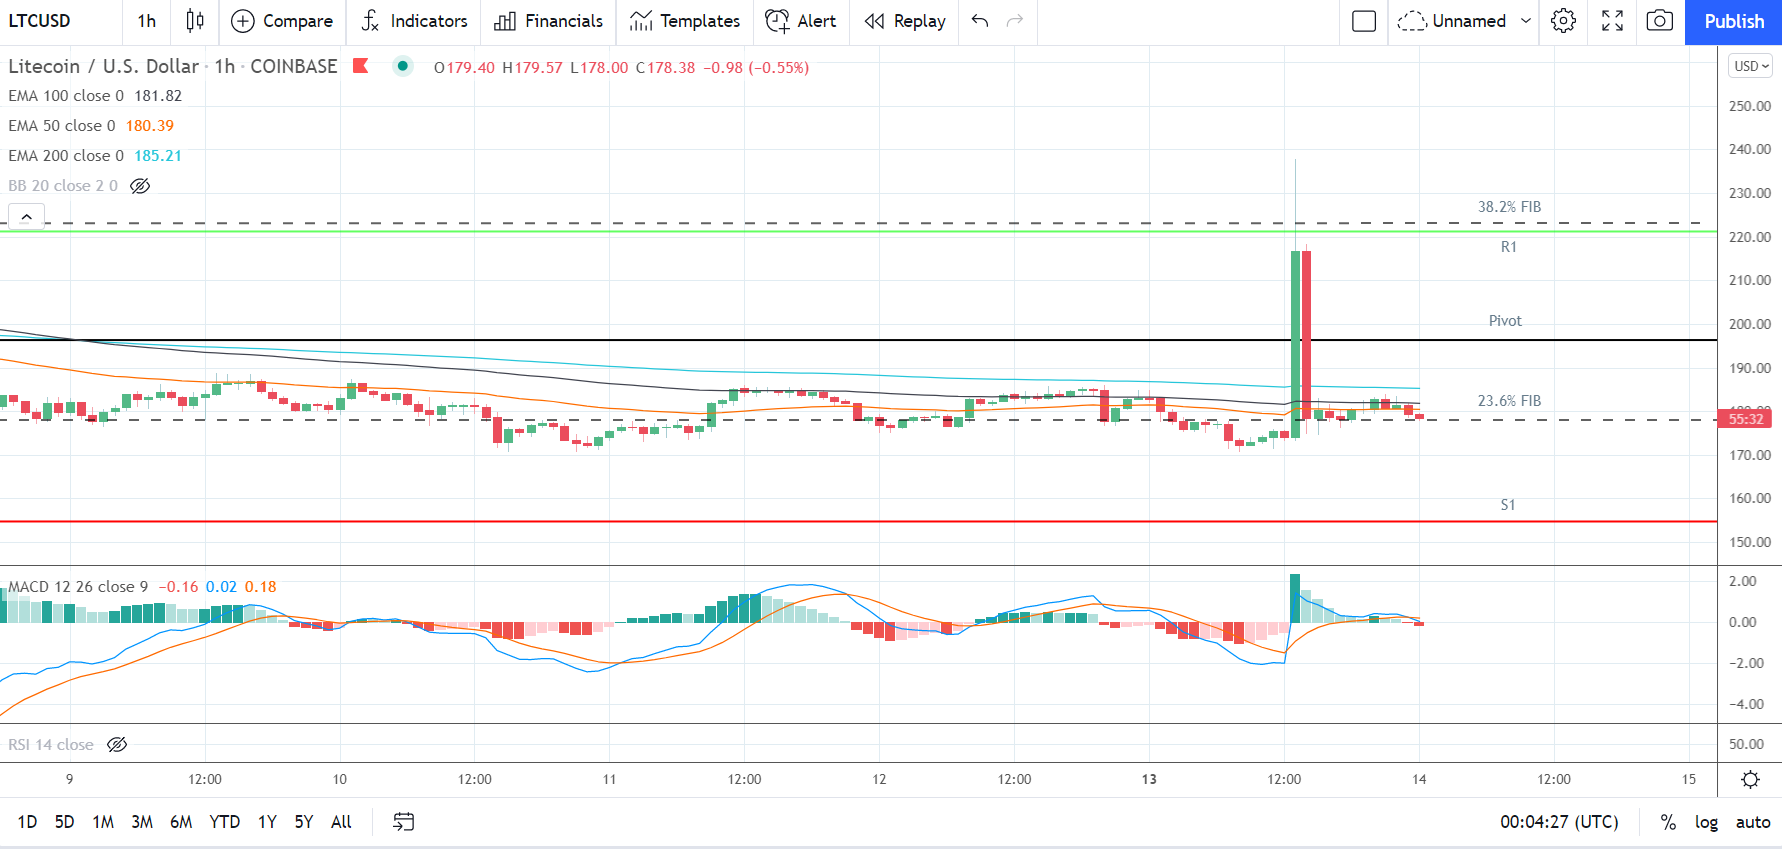
Litecoin fell by 1.99% on Monday. Following a 2.45% decline on Sunday, Litecoin ended the day at $179.36.
A bearish start to the day saw Litecoin fall to an early morning intraday low $170.82 before making a move.
Litecoin fell through the 23.6% FIB of $178 and the first major support level at $177.
Finding support at the second major support level at $171, however, Litecoin surged to an early afternoon intraday high $237.88.
Litecoin broke back through the 23.6% FIB and broke through the day’s major resistance levels.
More significantly, Litecoin also broke through the 38.2% FIB of $223 before hitting reverse.
The reversal saw Litecoin fall back through the 38.2% FIB and the major resistance levels to end the day at $179 levels.
At the time of writing, Litecoin was down by 0.55% to $178.38. A mixed start to the day saw Litecoin fall from an early morning high $179.57 to a low $178.00.
While leaving the major support and resistance levels untested, Litecoin tested support at the 23.6% FIB of $178.
For the day ahead
Litecoin would need to move through the $196 pivot to bring the first major resistance level at $221 into play.
Support from the broader market would be needed, however, for Litecoin to break back through to $200 levels.
Barring an extended crypto rally, resistance at $200 would likely leave Litecoin short of the first major resistance level and the 38.2% FIB of $223.
In the event of another breakout, Litecoin could test resistance at Monday’s high $237.88. The second major resistance level sits at $263.
Failure to move through the $196 pivot would bring the 23.6% FIB of $178 and the first major support level at $154 into play.
Barring another extended sell-off, however, Litecoin should steer clear of sub-$170. The second major support level sits at $129.
Looking at the Technical Indicators
First Major Support Level: $154
Pivot Level: $196
First Major Resistance Level: $221
23.6% FIB Retracement Level: $178
38.2% FIB Retracement Level: $223
62% FIB Retracement Level: $296
Ripple’s XRP
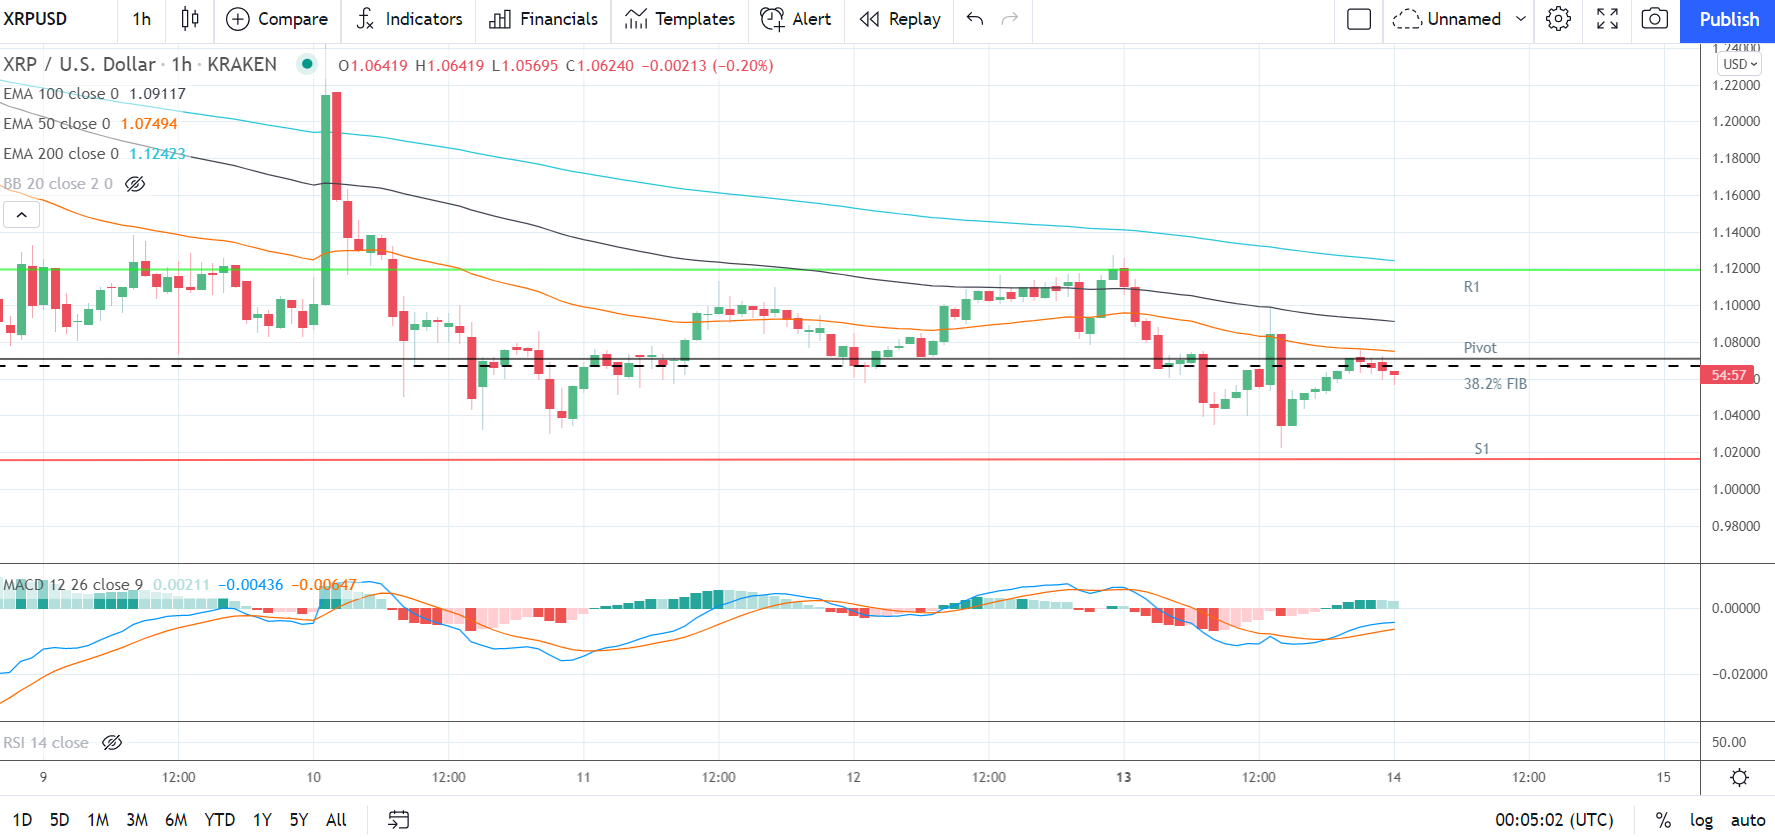
Ripple’s XRP slid by 4.95% on Monday. Reversing a 3.93% gain from Sunday, Ripple’s XRP ended the day at $1.06453.
A mixed start to the day saw Ripple’s XRP rise to an early morning intraday high $1.12568 before hitting reverse.
Falling short of the first major resistance level at $1.1451, Ripple’s XRP tumbled to an early afternoon intraday low $1.02285.
Ripple’s XRP fell through the first major support level at $1.0765 and the second major support level at $1.0331.
The extended sell-off also saw Ripple’s XRP fall through the 38.2% FIB of $1.0659 before finding late support.
Late in the day, Ripple’s XRP broke back through the second major support level to end the day at $1.064 levels.
At the time of writing, Ripple’s XRP was down by 0.20% to $1.06240. A mixed start to the day saw Ripple’s XRP fall from an early morning high $1.06419 to a low $1.05695.
Ripple’s XRP left the major support and resistance levels untested early on.
For the day ahead
Ripple’s XRP would need to move through the 38.2% FIB of $1.0659 and the $1.0710 pivot to bring first major resistance level at $1.1192 into play.
Support from the broader market would be needed, however, for Ripple’s XRP to break out from $1.10 levels.
Barring an extended crypto rally, the first major resistance level and Monday’s high $1.12568 would likely cap the upside.
In the event of a broad-based crypto rebound, Ripple’s XRP could test resistance at $1.20 levels before any pullback. The second major resistance level sits at $1.1739.
Failure to move through the 38.2% FIB of $1.0659 and the $1.0710 pivot would bring the first major support level at $1.0164 into play.
Barring another extended sell-off, however, Ripple’s XRP should steer clear of sub-$1.00 levels. The second major support level sits at $0.9682.
Looking at the Technical Indicators
First Major Support Level: $1.0164
Pivot Level: $1.0710
First Major resistance Level: $1.1192
23.6% FIB Retracement Level: $0.8533
38.2% FIB Retracement Level: $1.0659
62% FIB Retracement Level: $1.4096
Please let us know what you think in the comments below.
Thanks, Bob
About the Author
Bob Masonauthor
With over 20 years of experience in the finance industry, Bob has been managing regional teams across Europe and Asia and focusing on analytics across both corporate and financial institutions. Currently he is covering developments relating to the financial markets, including currencies, commodities, alternative asset classes, and global equities.
Did you find this article useful?
Latest news and analysis


Advertisement