


Bitcoin, BTC/USD, Tesla, BNY Mellon, Mastercard – Talking Points:
- Tesla, Mastercard and BNY Mellon’s endorsement of Bitcoin as a mainstream financial asset may intensify capital flows.
- Rising inflation expectations, loose monetary policy conditions and fiscal stimulus prospects could also put a premium on the anti-fiat asset.
- However, recent price action suggests that a short-term pullback could be in the offing.
As mentioned in previous reports, Tesla’s $1.5 billion investment in Bitcoin and its plans to begin accepting the popular cryptocurrency as a form a payment, has fostered the anti-fiat asset’s surge higher in recent weeks. Indeed, the digital currency has climbed over 74% for the year and looks set to continue gaining ground on the back of loose monetary policy conditions and the expectation of further fiscal support out of the US.
Moreover, Bank of New York Mellon’s statement that it would treat BTC the same as any other financial asset and Mastercard’s commitment to integrate Bitcoin into its payment networks, may further validate the cryptocurrency as a mainstream asset and intensify capital inflows in the near term. Here are the key levels to watch for BTC/USD.
BTC/USD Weekly Chart – Cluster of Fibonacci Expansion Levels in Focus
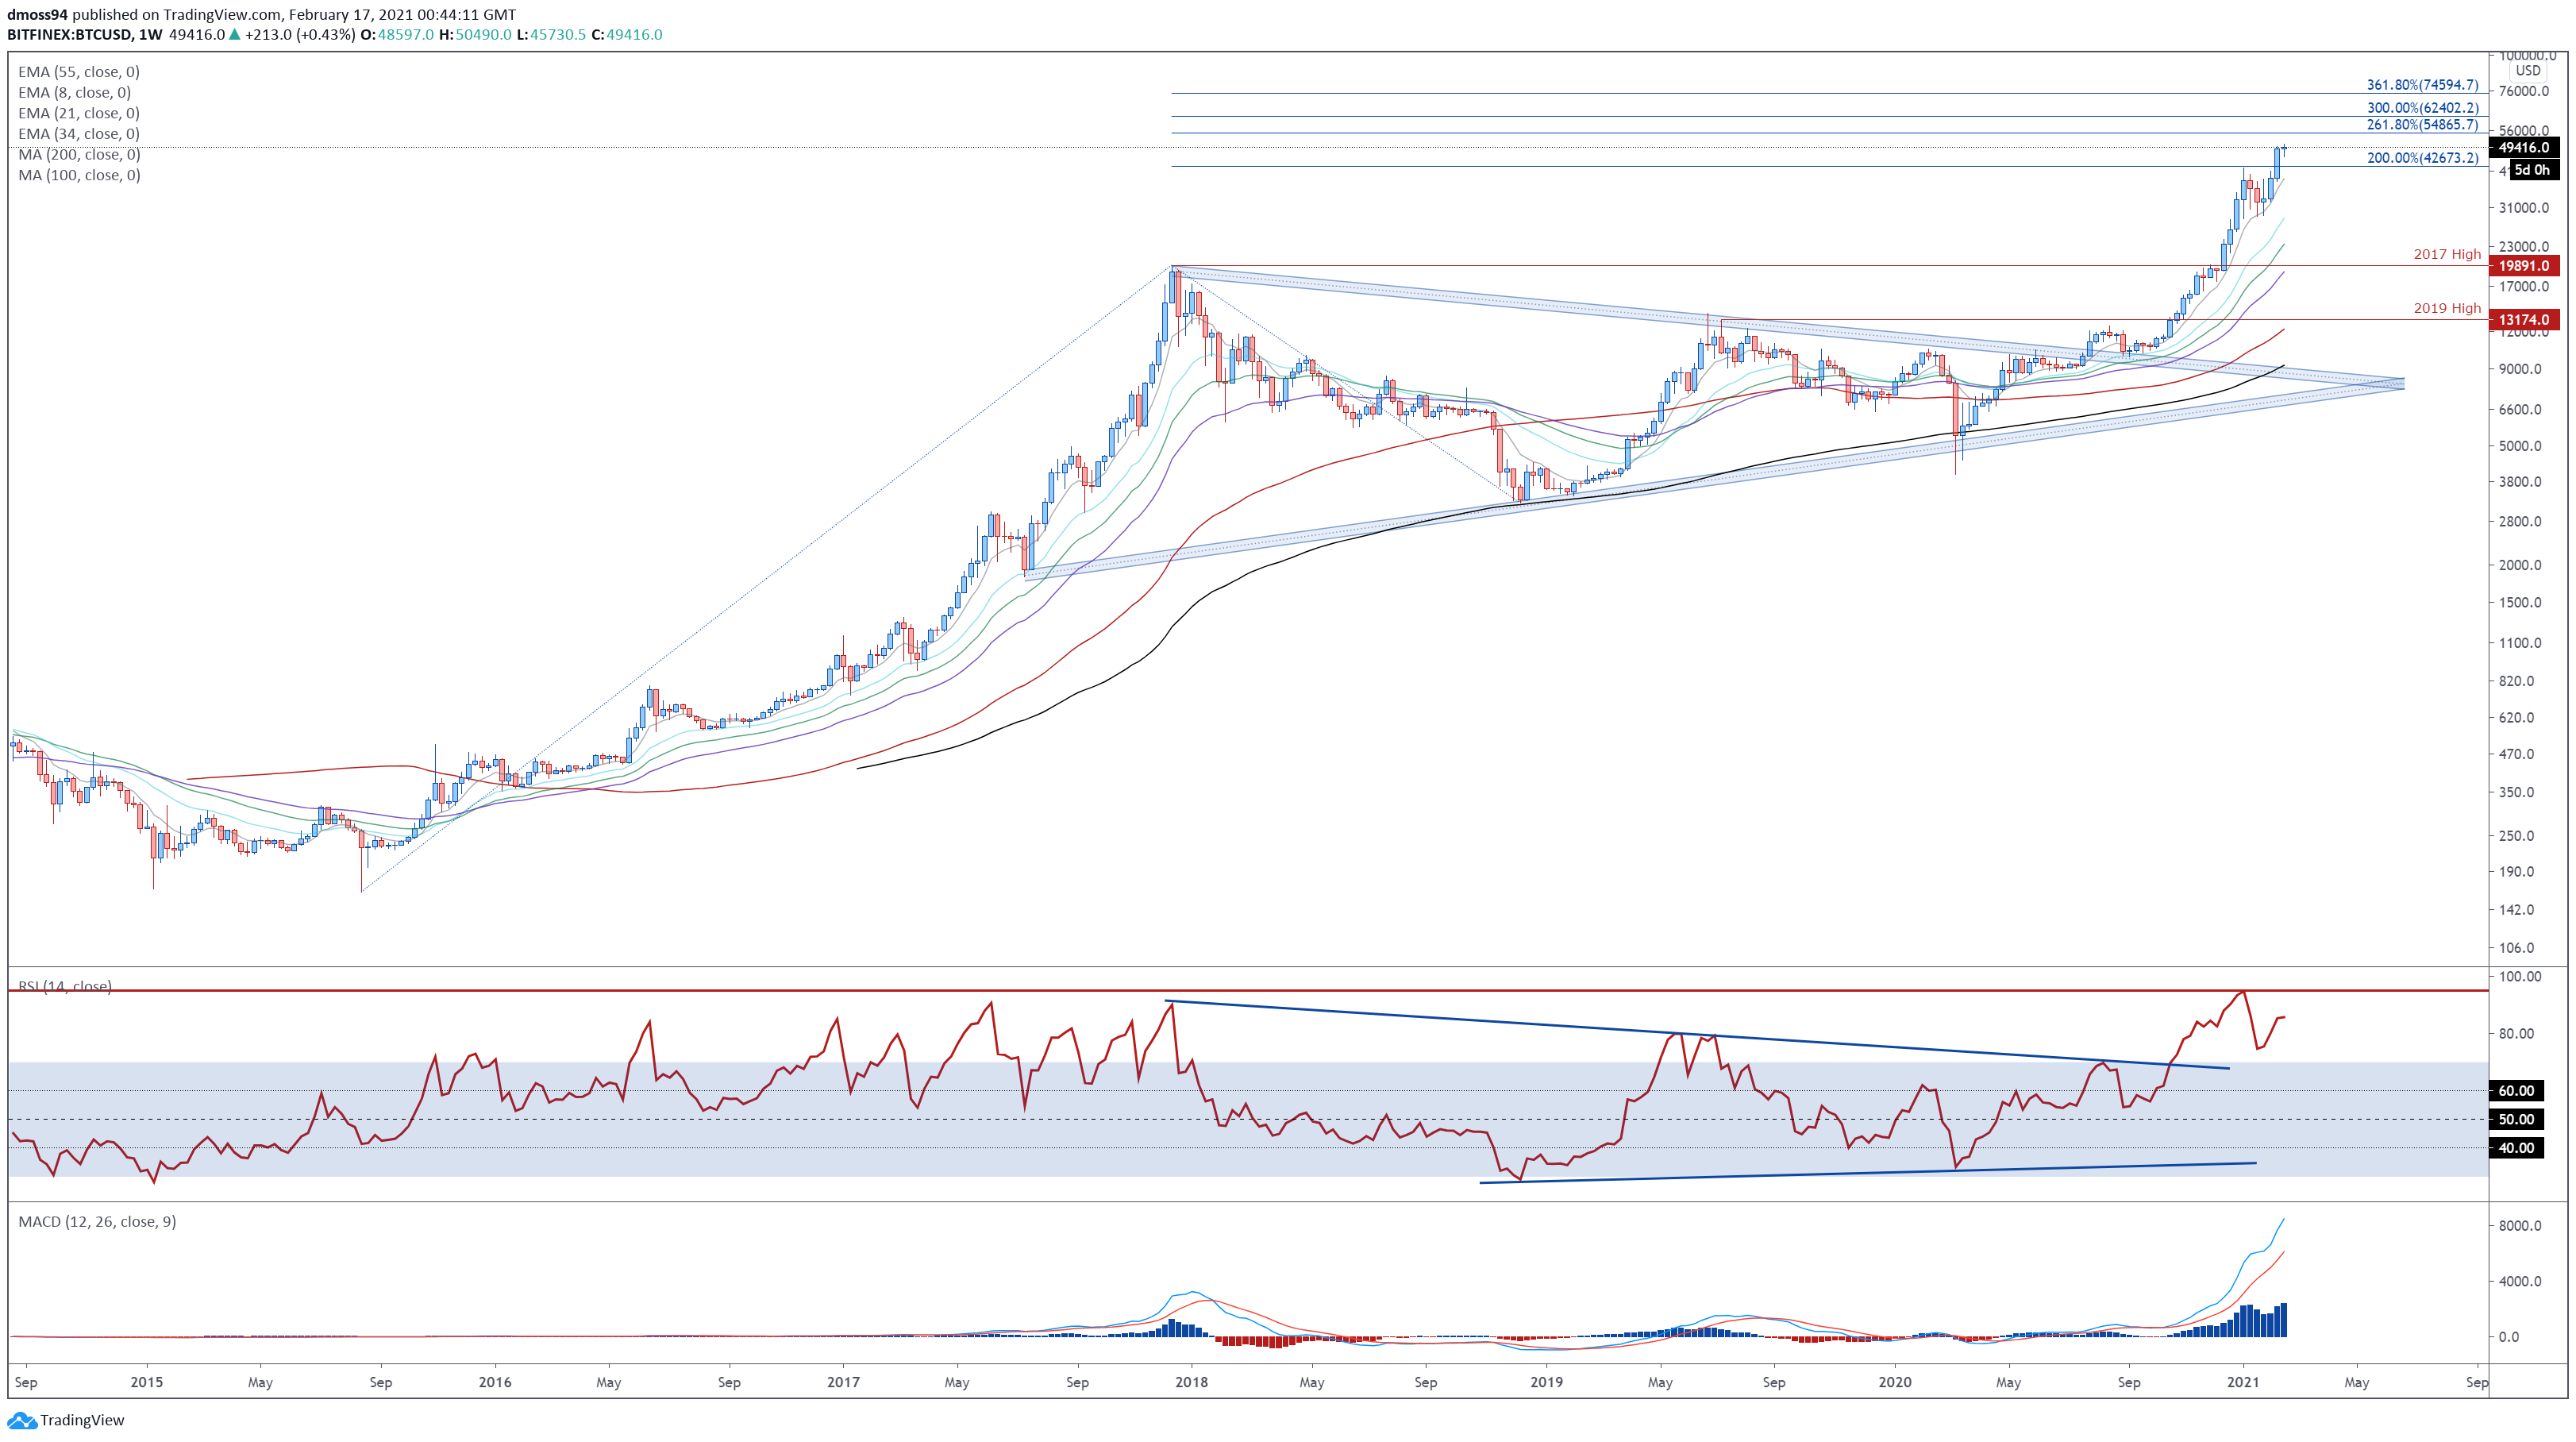
BTC/USD weekly chart created using Tradingview
The long-term outlook for Bitcoin remains overtly bullish, as price tracks firmly above all six moving averages, and the MACD indicator surges to its highest levels on record.
However, bearish RSI divergence suggests that the relentless surge higher could be running out of steam. With that in mind, failing to gain a firm foothold above 50,000 could trigger a short-term pullback to former resistance-turned-support at the January high (41969).
Breaching that opens the door for sellers to drive the cryptocurrency back to psychological support at the 30,000 mark. That being said, an extended pullback seems relatively unlikely given the RSI remains comfortably above 70, and the marked steepening of all six moving averages.
Therefore, a weekly close above 50,000 would likely intensify buying pressure and carve a path for price to challenge the 261.8% Fibonacci (54866). Clearing that brings the 300% Fibonacci (62402) into the crosshairs.
BTC/USD Daily Chart – Bearish RSI Divergence Hints at Exhaustion

BTC/USD daily chart created using Tradingview
Zooming into the daily timeframe suggests that a short-term pullback could be in the offing, as a series of Doji and Hammer candles form just shy of the psychologically imposing 50,000 mark.
Bearish divergence on both the MACD and RSI also hint at fading bullish momentum, and could ultimately encourage would-be sellers if price slips back below the 8-EMA (47363).
Slicing through the February 15 low (45730) probably triggers a short-term correction back towards former resistance-turned-support at the January high (41969).
Alternatively, a daily close above 50,000 would likely signal the resumption of the primary uptrend and bring the 261.8% Fibonacci (54866) into focus.
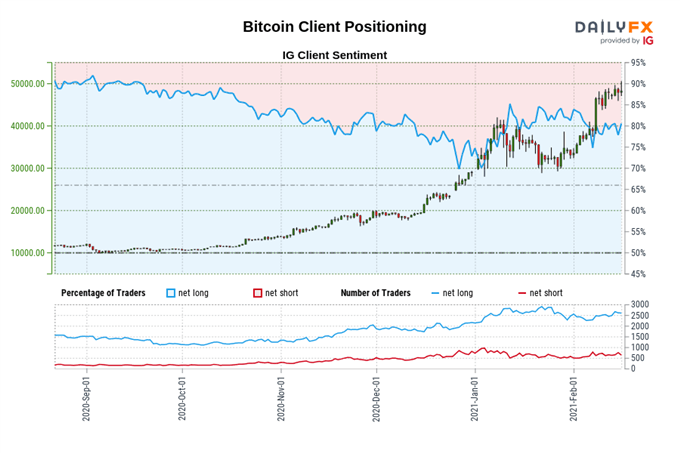
The IG Client Sentiment Report shows 79.17% of traders are net-long with the ratio of traders long to short at 3.80 to 1. The number of traders net-long is 7.11% lower than yesterday and 0.80% lower from last week, while the number of traders net-short is 8.29% higher than yesterday and 5.36% lower from last week.
We typically take a contrarian view to crowd sentiment, and the fact traders are net-long suggests Bitcoin prices may continue to fall.
Positioning is less net-long than yesterday but more net-long from last week. The combination of current sentiment and recent changes gives us a further mixed Bitcoin trading bias.
-- Written by Daniel Moss, Analyst for DailyFX
Follow me on Twitter @DanielGMoss


