


Bitcoin, BTC, BTC/USD Talking Points:
- It’s been a wild three weeks in Bitcoin as the holiday breakout continued through the New Year.
- Bitcoin set a fresh all-time-high last Friday at 42,000; but since then has dropped by as much as 28% before recovering.
- This week’s price action has seen Bitcoin narrow into a symmetrical triangle, often approached with the expectation of an eventual breakout. To learn more about triangle formations, join us in DailyFX Education.
It was probably pretty difficult to trade through the New Year open without hearing about what was happening in Bitcoin. Making matters all the more interesting, even as risk factors continued to flare, Gold prices dropped precipitously while Bitcoin put in a major bullish breakout, eventually tagging the $42,000 level last Friday.
But – rarely do bullish trends translate in a linear fashion, and shortly after this week’s open Bitcoin began to pullback and, at one point, had retraced the bulk of last week’s breakout before finding some buyer support.
That bounce has now led into a round of digestion, and this digestion has shown so far in a somewhat orderly fashion, taking on the tone of a symmetrical triangle formation. Such formations will often show ahead of a breakout, as buying and selling pressure equalizes into a tighter and tighter range.
To learn more about triangle patterns, join us in DailyFX Education
Bitcoin BTC/USD Hourly Price Chart
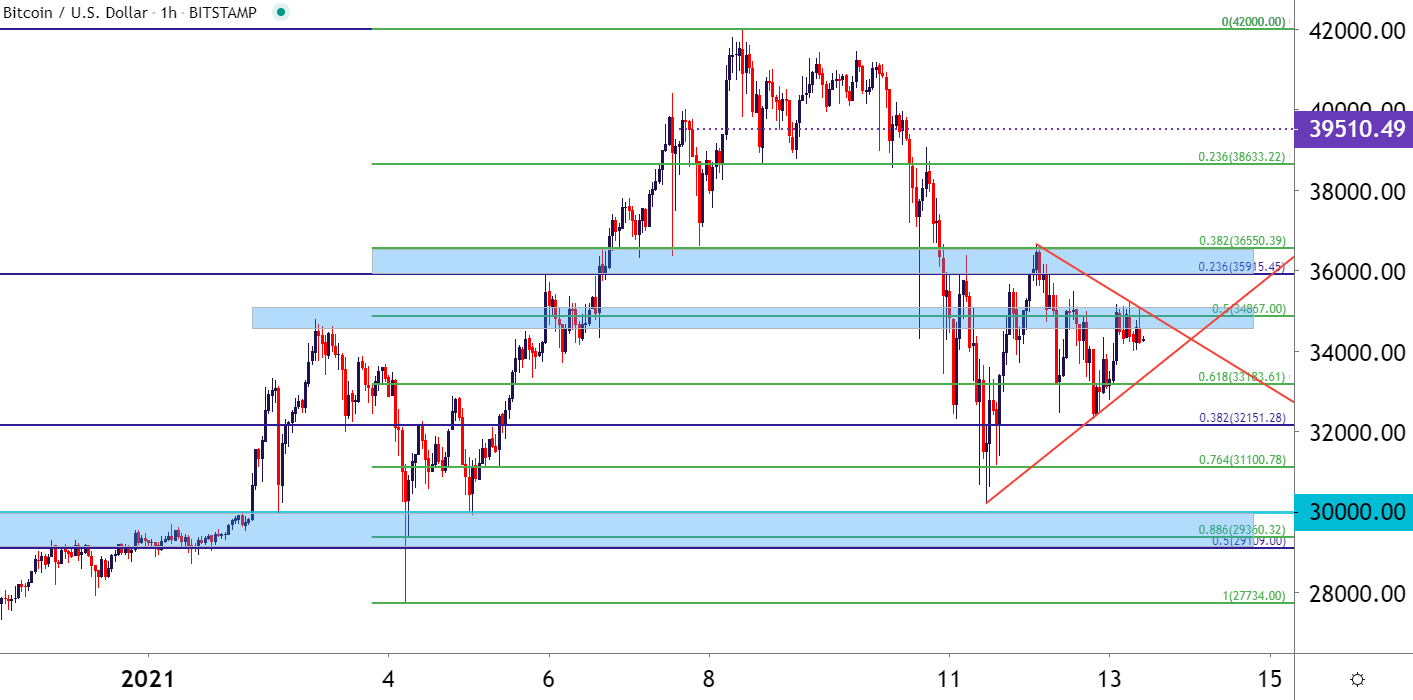
Chart prepared by James Stanley; Bitcoin on Tradingview
Bitcoin Edging for a Break – but in Which Direction?
Gold may have a case sample here as the extreme bullish breakout from earlier this summer has led into now five months of digestion. But Bitcoin took on a similarly overbought condition with this year’s breakout. Prices snapped back aggressively from that $42,000 level so, naturally, there are likely many that are looking at this from a pullback perspective in order to set up long positions or strategies in Bitcoin.
There may be more clearing out to do of support before that bullish look may come back in order, however, as the symmetrical wedge building after a sharp downward move can be argued as a bear pennant formation; and those types of backdrops are often followed with the aim of continuation-lower. This can put focus on support potential around the zone running from around 29,109 up to the 30k level.
Bitcoin BTC/USD Two-Hour Price Chart
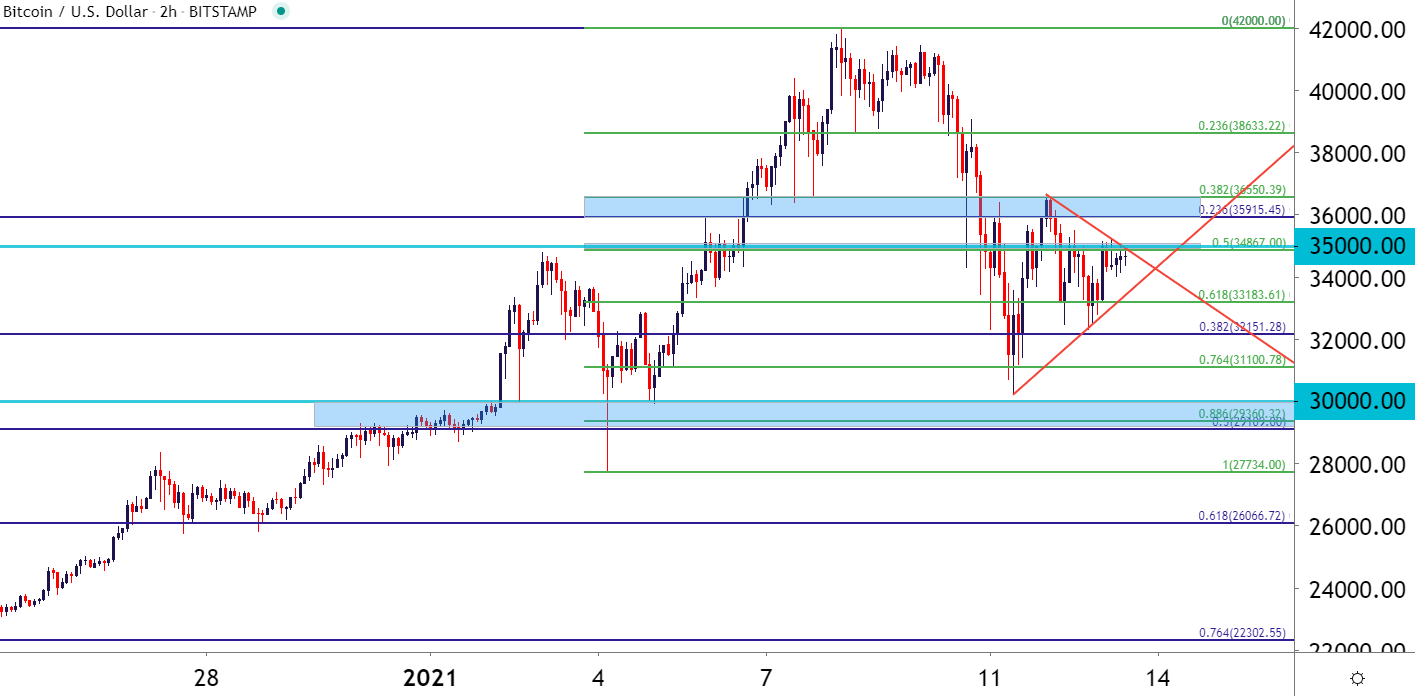
Chart prepared by James Stanley; Bitcoin on Tradingview
Bitcoin Levels
In this week’s technical forecast on Gold, I also included a chart of Bitcoin with a number of potential levels pointed out. And so far this week, there’s been a number of inflections off of these levels. The Fibonacci retracement spanning the current 2021 major move has been especially interesting, as the 76.4% retracement helped to cauterize support this week while the 50% marker is currently helping to hold resistance. The 61.8% retracement has put in some work as well, helping to shape short-term support, and the 38.2% retracement marks this week’s current high, and that was set yesterday. These levels are shown in Green on the below chart.
Bitcoin Two-Hour Price Chart
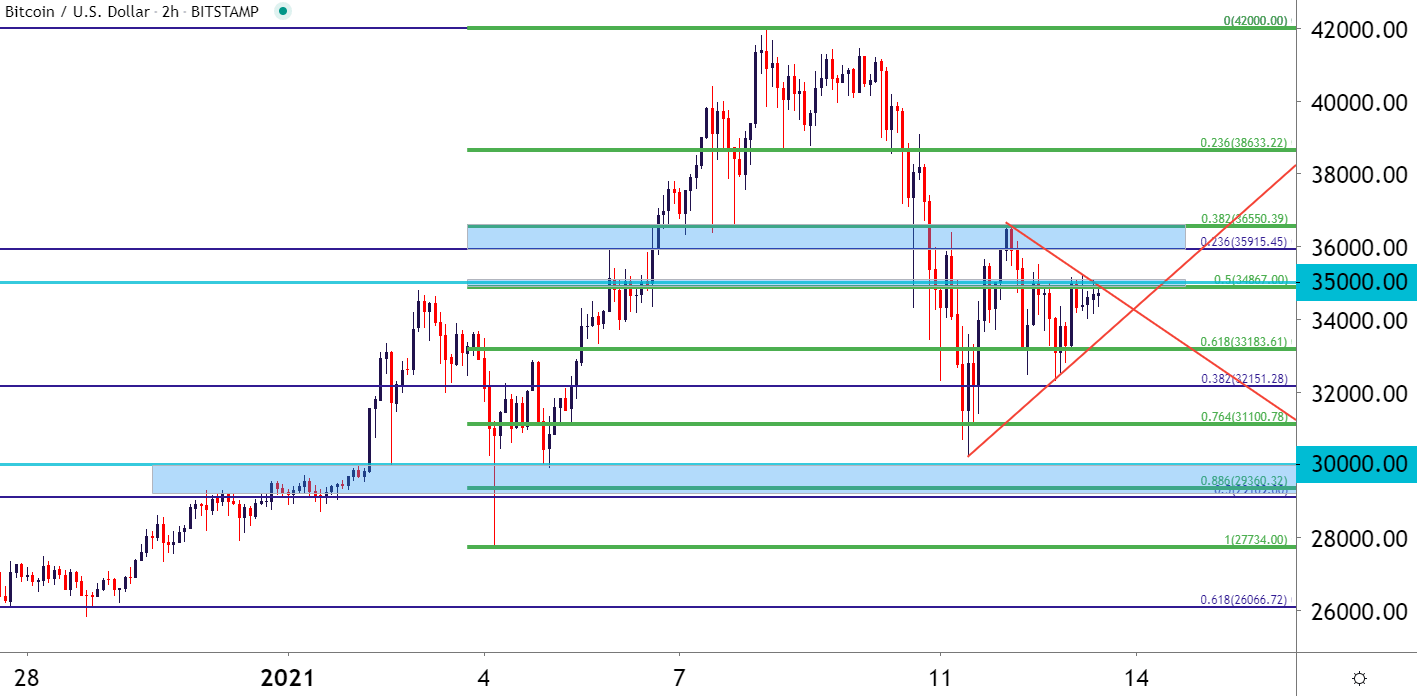
Chart prepared by James Stanley; Bitcoin on Tradingview
--- Written by James Stanley, Strategist for DailyFX.com
Contact and follow James on Twitter: @JStanleyFX


