


- Bitcoin price fails to sustain the weekend breakout above $10,400, hitting a barrier at $10,600.
- BTC/USD continues to trend within the toughest seller congestion zone between $10,311 and $10,620 according to on-chain metrics.
The flagship cryptocurrency briefly stepped above the stubborn resistance at $10,400 over the weekend where it traded very close to $10,600. Unfortunately, the momentum fizzled out, culminating in a drop back into the range ($10,000 – $10,400). At the time of writing, Bitcoin is exchanging hands at $10,316 amid a growing bearish grip.
The Relative Strength Index (RSI) in the 4-hour range puts emphasis on the increasing selling activities, especially with the drop under the midline. If the downtrend continues under 40 and towards 30 (oversold region), BTC may kick start another breakdown towards the range support at $10,000.
Related reading: Bitcoin Price Analysis: BTC/USD Hunting For Explosive Breakout, Is $11,200 The Rendezvous?
BTC/USD 4-hour chart
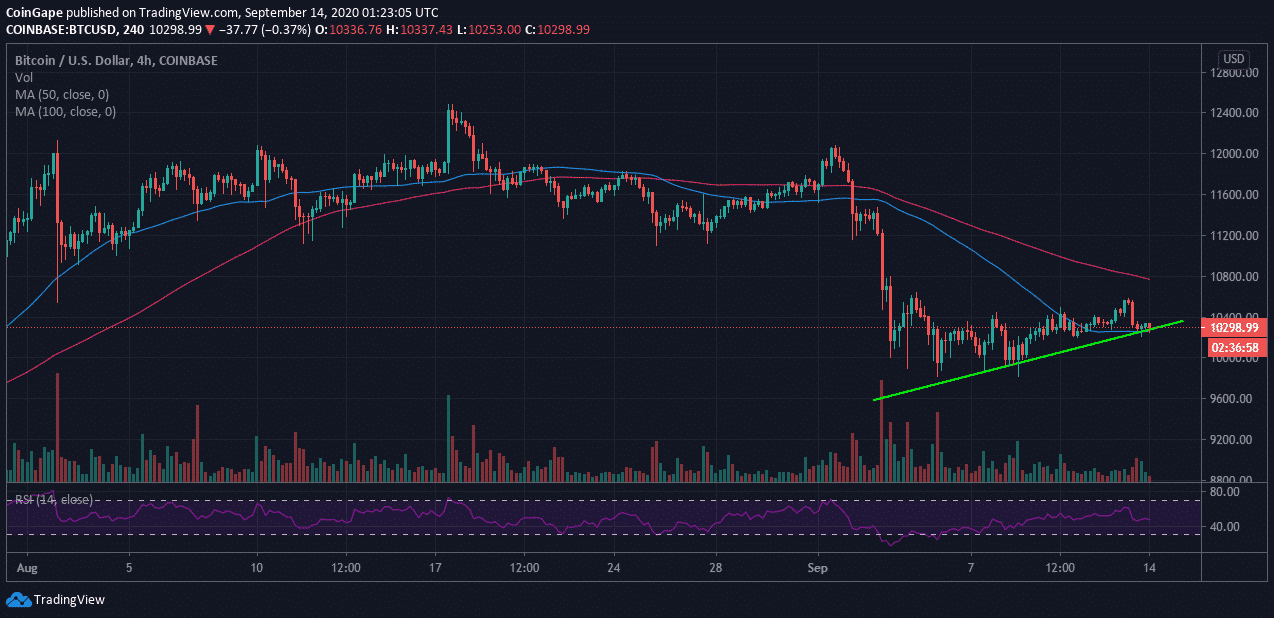
Meanwhile, the 50 Simple Moving Average at $10,265 is in line to offer much-needed support. If the price can hold above this zone, there is a likelihood of the bellwether cryptocurrency resuming the uptrend. The same downside is also protected by an ascending trendline. It is essential for Bitcoin to hold above this trendline to be safe from potential losses eyeing $10,000.
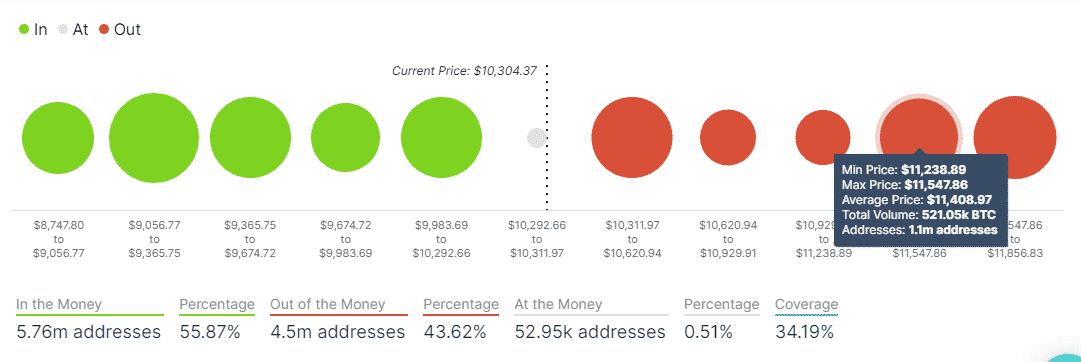
According to on-chain data by IntoTheBlock, Bitcoin is set to face its hardest test this week in the range between $10,311 and $10,620. Note that the resistance in this area is brought about by the 1.22 million addresses that previously purchased 827,250 BTC. However, if this zone is flipped into support, the largest cryptocurrency will have a relatively smooth ride above $11,000. The next critical resistance is highlighted between $11,238 and $11,547, a range where 1.1 million addresses bought 521,050 BTC.
Recommended Articles


Bitcoin Intraday Levels
Spot rate: $10,316
Relative change: -18.95
Percentage change: -0.22%
Trend: Bearish
Volatility: Low
Read more: Bitcoin Technical Analysis: BTC Blasts Through Triangle Resistance, All Eyes On $10,800
- Coin Center Asserts Stablecoin Bill Threatens Free Speech Rights
- IRS Shares Early Look at Crypto Reporting Form Set for 2025
- SEC Updates Complaint Against Justin Sun’s US Business Dealings
- Heightened US Debt Figures Boost Bitcoin and Gold Adoption
- Michael Saylor Pockets $370M From MicroStrategy Share Sale Before Bitcoin Halving
- Shiba Inu Price Analysis: Will Bitcoin’s Post-Halving Rally Push SHIB to $0.00004
- LUNC Price Analysis: Terra Classic Flashes Unique Buy Signal On Bitcoin Halving Eve
- XRP Price Prediction As XRP Hits $0.5 Amid Ripple Vs. SEC Intense Legal Battle
- Cardano Price Eyes $0.81 High as MVRV Ratio Signals Potential Rebound
- Gala Price Forecast: $1 Milestone In Sight After Bitcoin Halving?

 Pikamoon
  Poodl Inu


