
Disclaimer: This article attempts to analyze Bitcoin’s price movements over the next month leading up to a potential breakout in the last week of July.
For the past several weeks, Bitcoin appeared to be consolidating below $9,500 despite a short-lived upside break. So far, the coin managed to stay afloat above the critical $9,000-support level after multiple downside market corrections. At the time of writing, the largest cryptocurrency by market cap was valued at $9,088.
Bitcoin [BTC] Daily Chart:
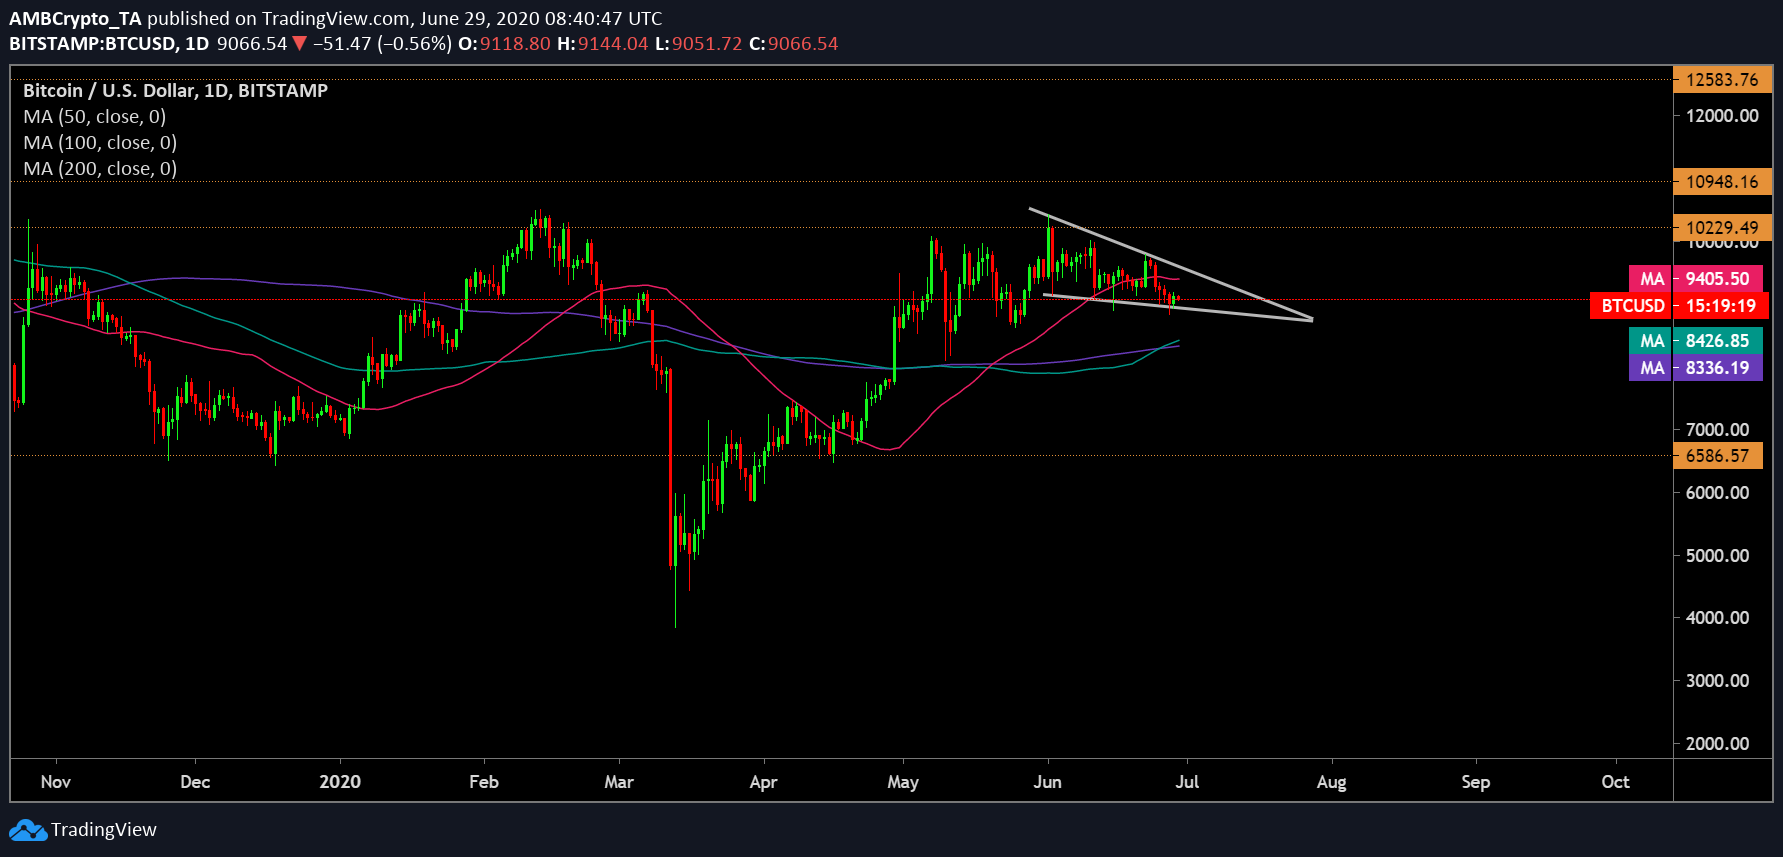
Source: BTC/USD on TradingView
As depicted in the chart above, the Bitcoin price candles appeared to be oscillating between the two trendlines of a falling wedge pattern, completion of which was expected to take shape in the last week of July. A bullish breakout could potentially follow the completion.
The daily moving averages were also bullish. The 50 DMA [Pink] continued to be on top of both the 100 DMA [Blue] as well as the 200 DMA [Purple]. In addition, the 100 DMA and the 200 DMA underwent a bullish crossover recently while resting well below the price candles.
The 50 DMA, however, moved above the BTC candlesticks. This could potentially signal towards the DMA resisting an upside breakout and a potential consolidation in the current range within the falling wedge formation.
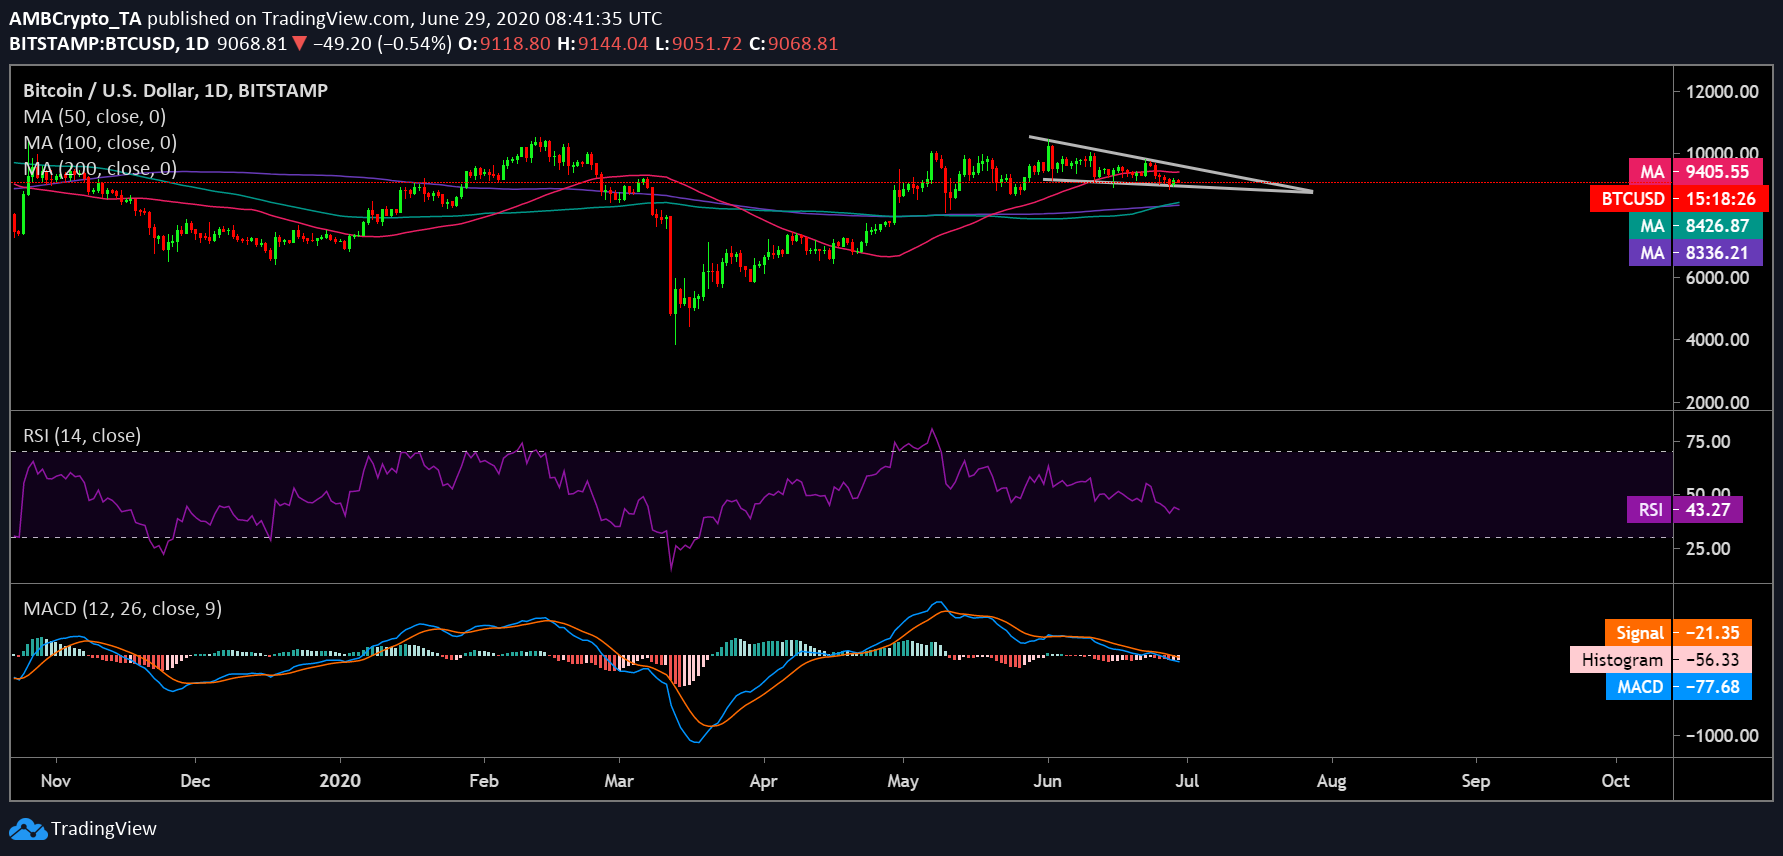
Source: BTC/USD on TradingView
The indicators also pointed towards a consolidation phase before a potential bullish breakout in the last week of July. The RSI slid below the 50-median line as it closely followed the price action of the coin. This essentially indicated a decline in buying pressure among the investors in the market as they expect the price to go down and hit the lower trendline of the wedge before a rebound. The MACD was also below the signal line depicting the current fall.
While Bitcoin could appear to be consolidating in the current price range, a potential bullish breakout was, however, on the cards in the long-term. The immediate resistance point was the 50 DMA at point $9,405. Subsequent target points stood at $10,229, and $10,948as the coin’s price was firmly supported by the both the 100 as well as the 200 DMAs.