Litecoin, the seventh-largest cryptocurrency in the market, has been consolidating within the range of $42-$45 for two weeks now, with the altcoin recording sideways price action since. Despite several breakout attempts, Litecoin has noted several rejections, and a look at the charts would suggest that the bears are here to stay.
Litecoin 1-Day Chart
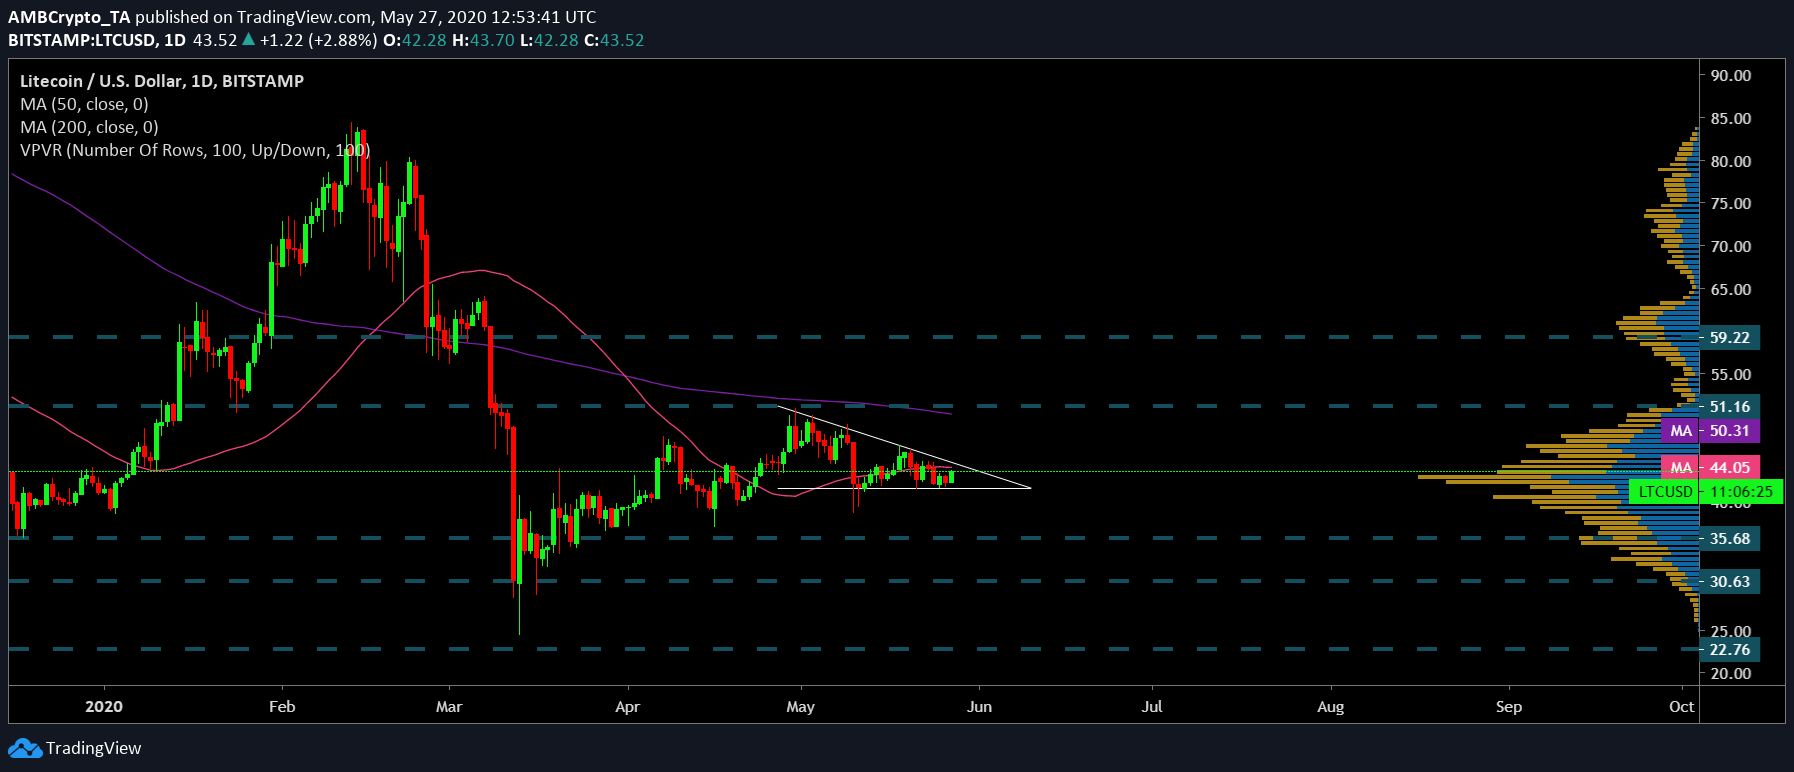
Source: LTC/USD on TradingView
A descending triangle pattern was taking shape on Litecoin’s daily chart. The completion of this pattern could potentially lead to a bearish breakout in the long-term. This was also supported by the placement of the daily moving averages. The 50 DMA [Pink] noted a minor upswing, which initially appeared to be decreasing the gauge with the 200 DMA [Purple] and hence, a bullish phase for the coin.
However, the prospect of a golden cross diminished as the two daily moving averages were moving parallel to each other, meaning a potential bearish phase could be ahead. In addition to the 200 DMA which hovered above the Litecoin price candles, the 50 DMA also climbed above candlesticks on 13 May as it continued to resist upward movement. This further validated the presence of the bears.
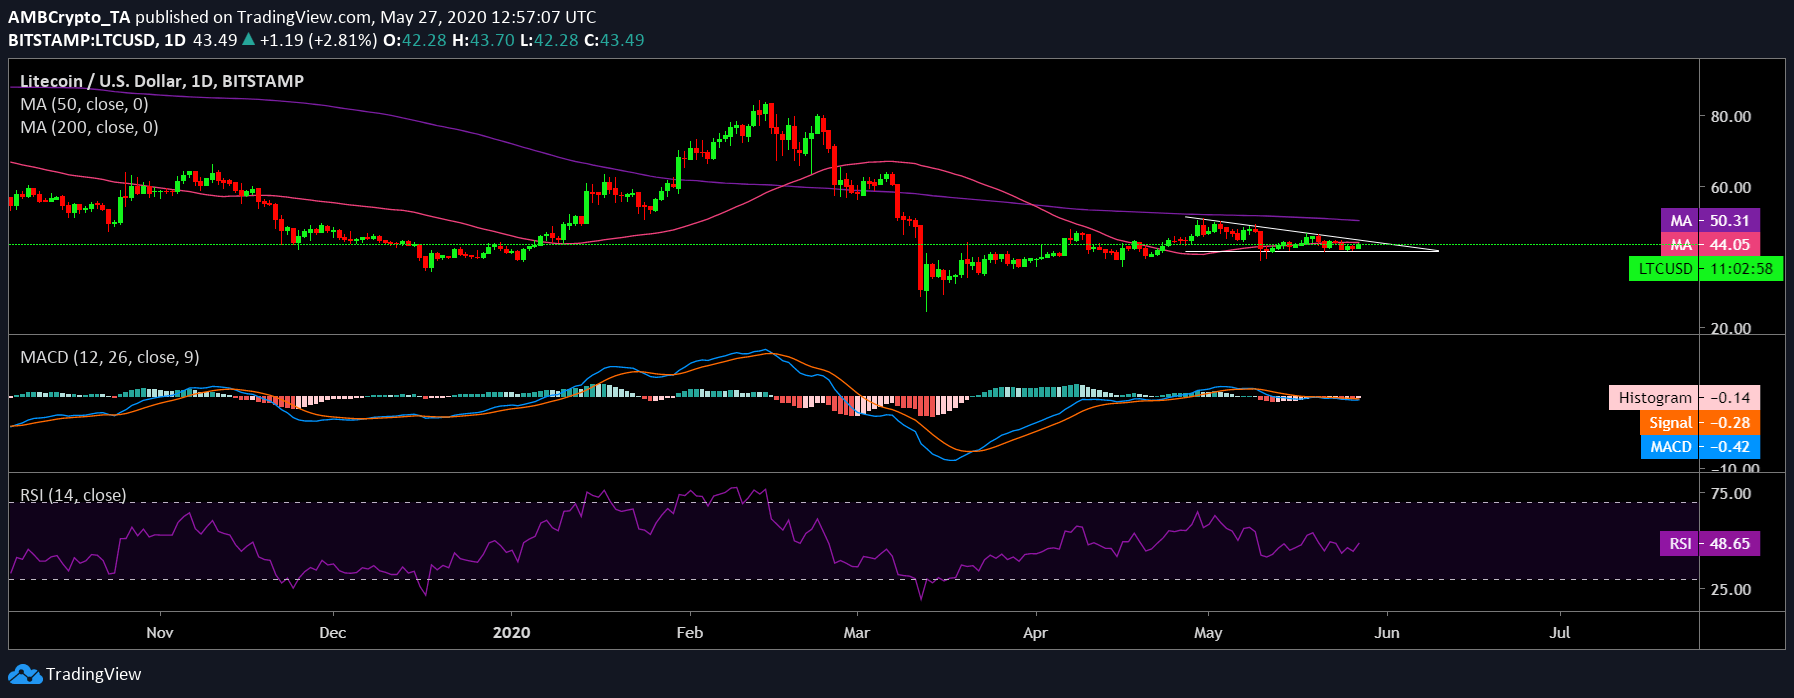
Source: LTC/USD on TradingView
Taking the technical indicators into consideration, it was found that they too pointed towards a bearish phase. The MACD, for instance, slid below the signal line, depicting the bears taking charge. The Relative Strength Index [RSI] was also below the 50-median neutral line. This pointed to a sentiment of sell pressure among the investors in the coin market.
Case 1
The descending channel pattern taking shape over a period of more than three weeks, the placement of daily moving averages, and the indicators, all pointed to a bearish breakout. If this materializes, the coin could find itself retesting target points at $35.68 and $30.63, levels which registered a high trading activity, according to the VPVR indicator. If the downward trend continues, it could also find itself retracing to the December ’18 lows near $22.76.
Case 2
While a case for trend reversal looks bleak, Litecoin’s price candles were resisted at points $51.16 and $59.22, levels not seen since March second week.
Correlation
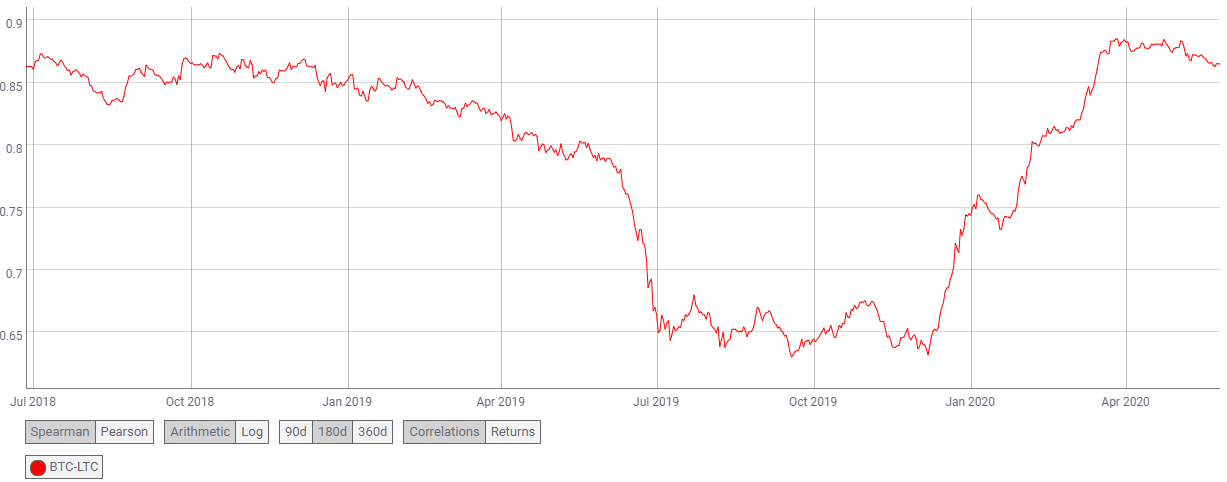
Source: Coin Metrics
Litecoin is the “silver to Bitcoin’s gold.” This adage holds true as the two coins not only share the same codebase, but also exhibit mostly similar price actions, rising and falling in tandem. At the time of writing, the BTC-LTC correlation coefficient stood at a high of 0.86. This was indicative of the fact that Bitcoin’s upward price movement would be able to catapult Litecoin’s price to breach significant resistance points.
Conclusion
The attached charts pointed towards a bearish breakout which could drive Litecoin to take a plunge all the way down to its support points at $35.68, $30.63 and $22.76, while its price faced resistance at $51.16 and $59.22