
ETHUSD Long-term Trend – Bearish
Distribution territories: $550.00, $600.00, $650.00.
Accumulation territories: $350.00, $300.00, $250.00.
Last week, Ethereum saw its value drop against the US dollar. The week before, the cryptocurrency saw its price appreciate. When the market closed on July 8, the pair was faintly showing bearish signals and these eventually led to a major decline, which occurred on July 10.

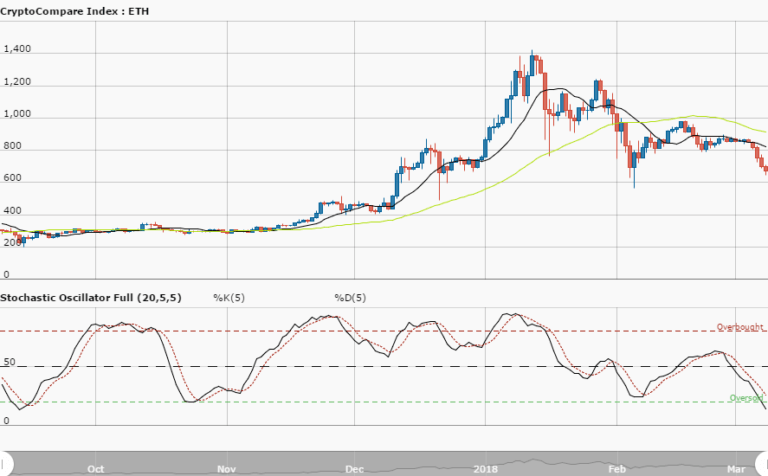
On the following day, ETH began moving in a range outlook until now. The bulls have been under the bears’ selling pressure. Ethereum’s price has been traded below the 14-day SMA. The 50-day SMA is located above the 14-day SMA.
The Stochastic Oscillators had initially moved north above range 40 but have now pulled back to point north a bit above range 20. This shows that the bears are getting weaker. There may be a strong price movement that will break the current ranging movements of the cryptocurrency either upward or downward.
The bulls are expected to have a strong comeback, especially while the cryptocurrency’s price is driven towards the accumulation territory of $400.00. Traders may be able to profit if they wait for this assumption to pan out and enter long positions then. Always ensure you’re properly managing your funds.
The views and opinions expressed here do not reflect that of CryptoGlobe.com and do not constitute financial advice. Always do your own research.


