
Advertisement
Advertisement
Bitcoin (BTC) News Today: Spot ETF Inflows Slow as Focus Turns to ETH
By:
Key Points:
- Bitcoin (BTC) declined by 0.80% on Tuesday (May 21), ending the session at $69,639.
- In contrast, ethereum (ETH) gained 3.50% on investor speculation about the SEC approving the first batch of ETH-spot ETFs on Thursday (May 23).
- On Wednesday (May 22), US BTC-spot ETF market flow data and ETH-spot ETF market-related chatter need consideration.

In this article:
US BTC-Spot ETF Market Flow Data Raise Uncertainty About Demand
On Tuesday (May 21), bitcoin (BTC) declined by 0.80%. Partially reversing a 5.97% rally from Monday (May 20), BTC ended the session at $69,639.
The US BTC-spot ETF market saw total net inflows of $237.2 million on Monday (May 20). Significantly, the BTC-spot ETF market reported total net inflows for the sixth session.
However, flow data for Tuesday (May 21) suggested waning demand amidst uncertainty about a September Fed rate hike.
According to Farside Investors,
- Grayscale Bitcoin Trust (GBTC) saw zero net flows on Tuesday, ending a four-day run of net inflows.
- Fidelity Wise Origin Bitcoin Fund (FBTC) saw net inflows of $25.8 million, down from net inflows of $64.0 million on Monday (May 20).
- Bitwise Bitcoin ETF (BITB) reported net outflows of $4.2 million, the first since May 1.
- VanEck Bitcoin Trust (HODL) saw net outflows of $5.9 million, a first since May 1.
- Excluding iShares Bitcoin Trust (IBIT), the US BTC-spot ETF market reported total net inflows of only $15.7 million.
Since January 11, 2024, the US BTC-spot ETF market saw total net inflows of $12,883.4 million. It remains a two-horse race in May. Since launch, IBIT And FBTC saw total net inflows of $15,700.7 million and $8,575.7 million, respectively.
However, there is uncertainty about the likely flow trends for a US ETH-spot ETF market. Investors could be holding off acquiring BTC-spot ETFs in anticipation of a US ETH-spot ETF market. Alternatively, demand has softened amidst investor uncertainty about the Fed interest rate trajectory.
Hong Kong ETF Market Gives No Insights Into Likely Demand for ETH-Spot ETFs
The Hong Kong crypto-spot ETF market gives no clues on whether a US ETH-spot ETF market could also thrive. According to Farside Investors, the HK BTC-spot ETF market has seen total net outflows of $14.8 million since launching on May 2. Furthermore, the HK ETH-spot ETF market reported total net outflows of $17.2 million.
Nevertheless, ETH gained 3.50% on Tuesday (May 21), extending the 19.23% breakout from Monday (May 20).
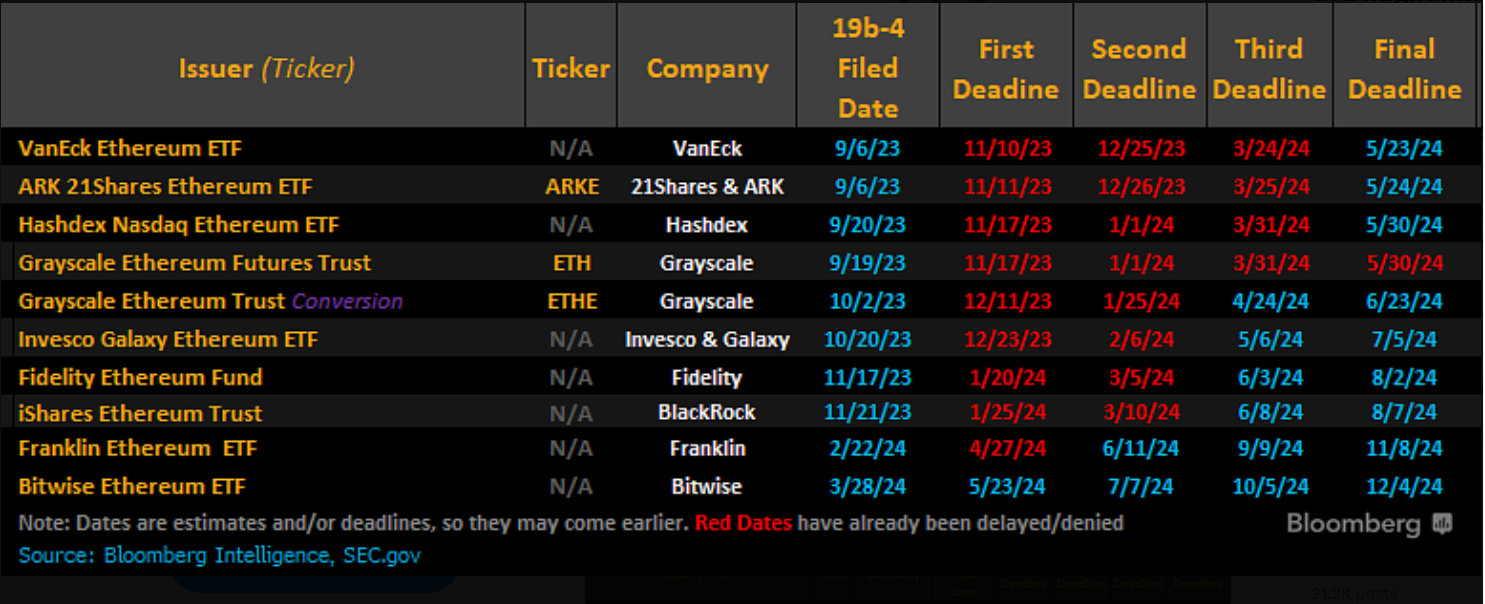
Bloomberg Intelligence ETF Analyst James Seyffart shared the latest ETH-spot ETF news, saying,
“UPDATE: It’s happening. We have at least 5 of the potential Ethereum ETF issuers that have submitted their Amended 19b-4’s in the last ~25 min. Fidelity, VanEck, Invesco/Galaxy, Ark/21Shares, & Franklin all submitted via CBOE.”
Seyffart added,
“Still a potentially long way from a launch. But these filings prove that all of the rumors and speculation and chatter have been accurate. Need to actually see SEC approval orders on all the 19b-4s AND THEN we need to see S-1 approvals. Could be weeks or more before ETFs launch.”
Grayscale filed its updated 19b-4 for the Ethereum Mini Trust earlier in the Tuesday session.
Amendments reportedly centered around the removal of staking.
The final deadline for VanEck Ethereum ETF is Thursday (May 23). Approvals could drive buyer demand for ETH. However, investors should follow flow trends after launch to ascertain demand and price trends.
Technical Analysis
Bitcoin Analysis
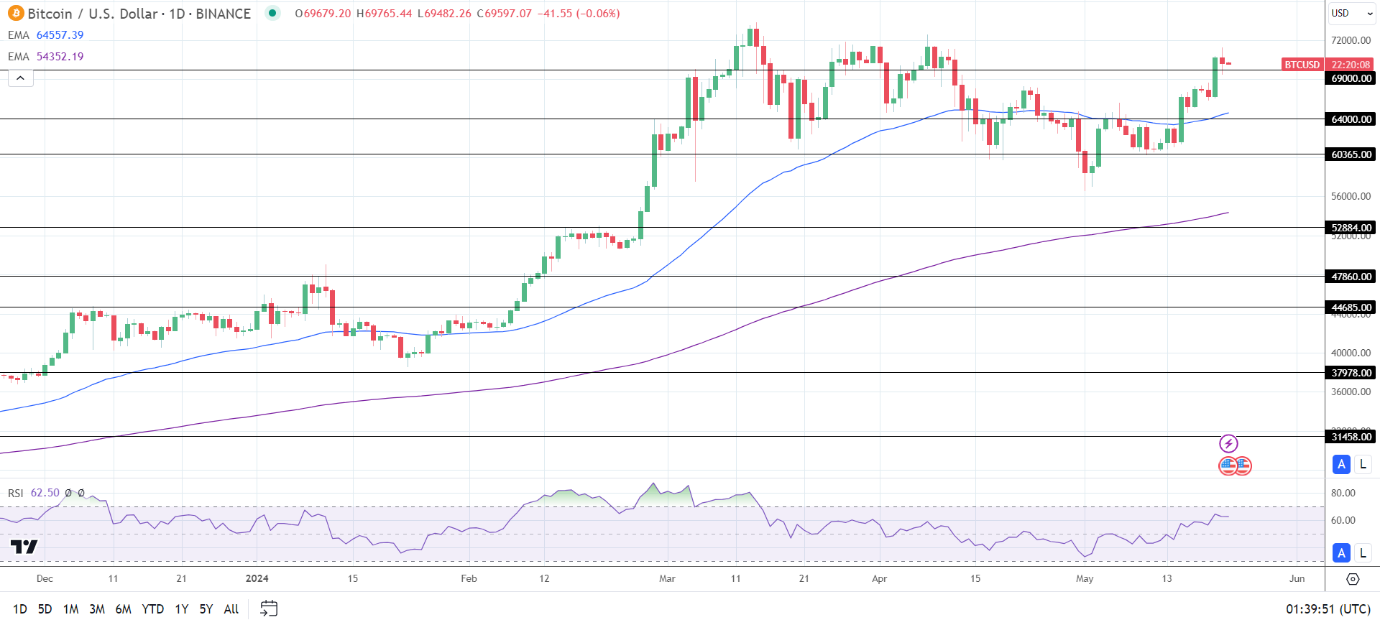
BTC sat well above the 50-day and 200-day EMAs, confirming the bullish price trends.
A BTC return to $70,000 could give the bulls a run at the $73,808 all-time high. A break above $73,808 would bring the $75,000 handle into play.
Fed chatter, US BTC-spot ETF market flow data, and ETH-spot ETF market-related updates need consideration.
Conversely, a BTC fall through the $69,000 support level could signal a BTC drop toward the 50-day EMA and the $64,000 resistance level.
With a 62.50 14-Daily RSI reading, BTC may return to the all-time high of $73,808 before entering overbought territory.
Ethereum Analysis
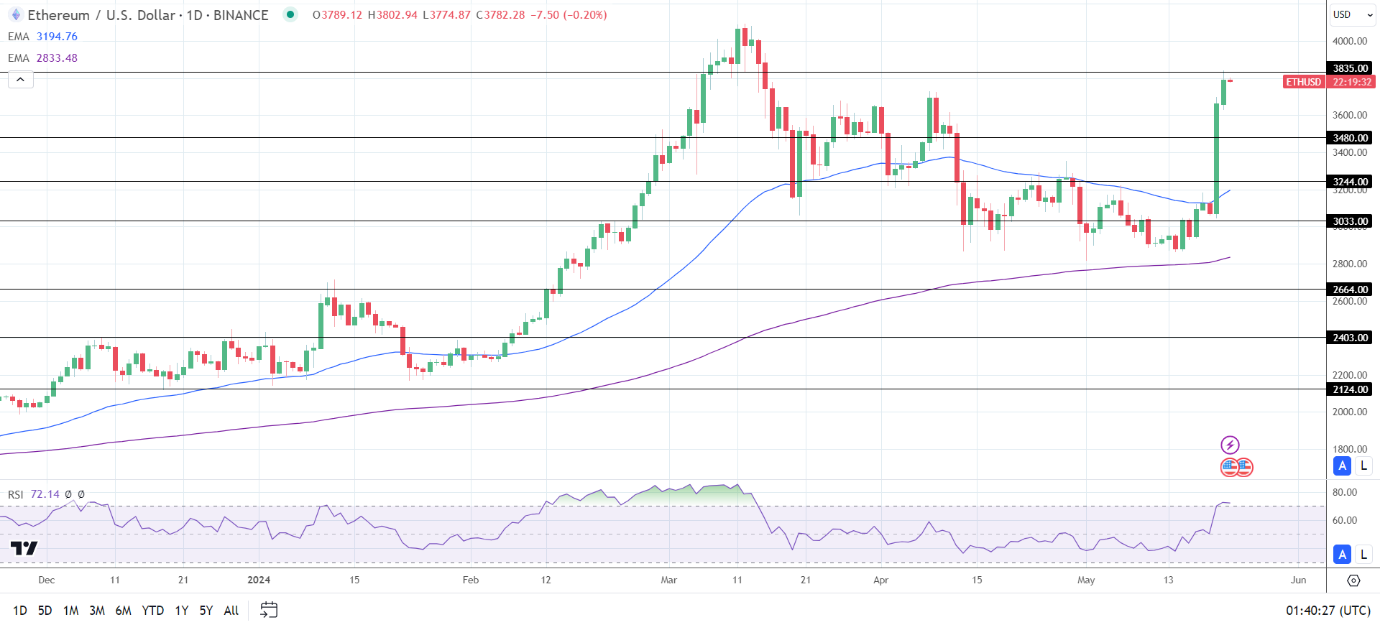
ETH held above the 50-day and 200-day EMAs, affirming the bullish price signals.
An ETH break above the $3,835 resistance level would support a move to the $4,000 handle. A return to the $4,000 handle could give the bulls a run at the March high of $4,091.
Conversely, an ETH fall through the $3,700 handle could signal a drop toward the $3,480 support level.
The 14-period Daily RSI reading, 72.14, shows ETH in overbought territory. Selling pressure may increase at the $3,800 handle.
About the Author
Bob Masonauthor
With over 20 years of experience in the finance industry, Bob has been managing regional teams across Europe and Asia and focusing on analytics across both corporate and financial institutions. Currently he is covering developments relating to the financial markets, including currencies, commodities, alternative asset classes, and global equities.
Did you find this article useful?
Latest news and analysis


Advertisement